Amid favorable supply and demand market dynamics, 2024 presents a golden opportunity for senior housing communities to bolster occupancy rates and drive operational growth, thereby mitigating some of the challenges posed by capital market conditions.
NIC Analytics recently published its first occupancy stratification report, focusing on the stabilized occupancy¹ distribution within the senior housing sector in 2023. The report reviews how senior housing communities are faring after 10 quarters of occupancy growth and recovery, fueled by a combination of robust demand and moderate new supply, reflected in the absorption to inventory velocity (AIV Ratio).
The report offers an outlook for stabilized occupancy in 2024 and examines stabilized occupancy distribution in 2023 across various dimensions, including NIC MAP market aggregates, regional variations, chain sizes, community types, payment types (CCRCs), community sizes, community ages, campus types, and profit statuses. Additionally, it provides occupancy distribution across select NIC MAP Primary and Secondary Markets.
The past three years have seen a remarkable resurgence in demand for senior housing as the markets registered the strongest unit improvement in net positive absorption, as measured by the change in occupied stock, since NIC MAP began reporting the data back in 2005. Not surprisingly, however, the pace of occupancy recovery varies across communities, markets, and other dimensions tracked by NIC MAP Vision.
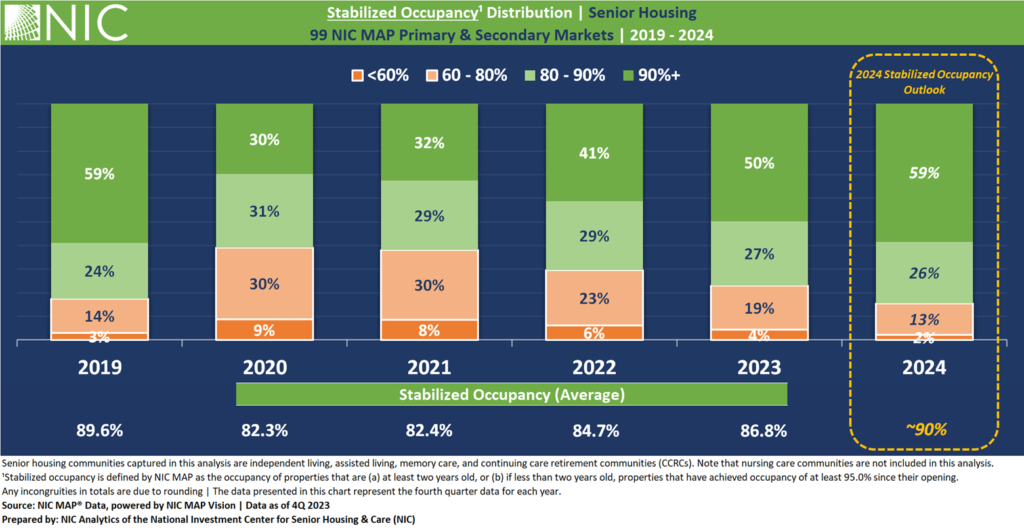
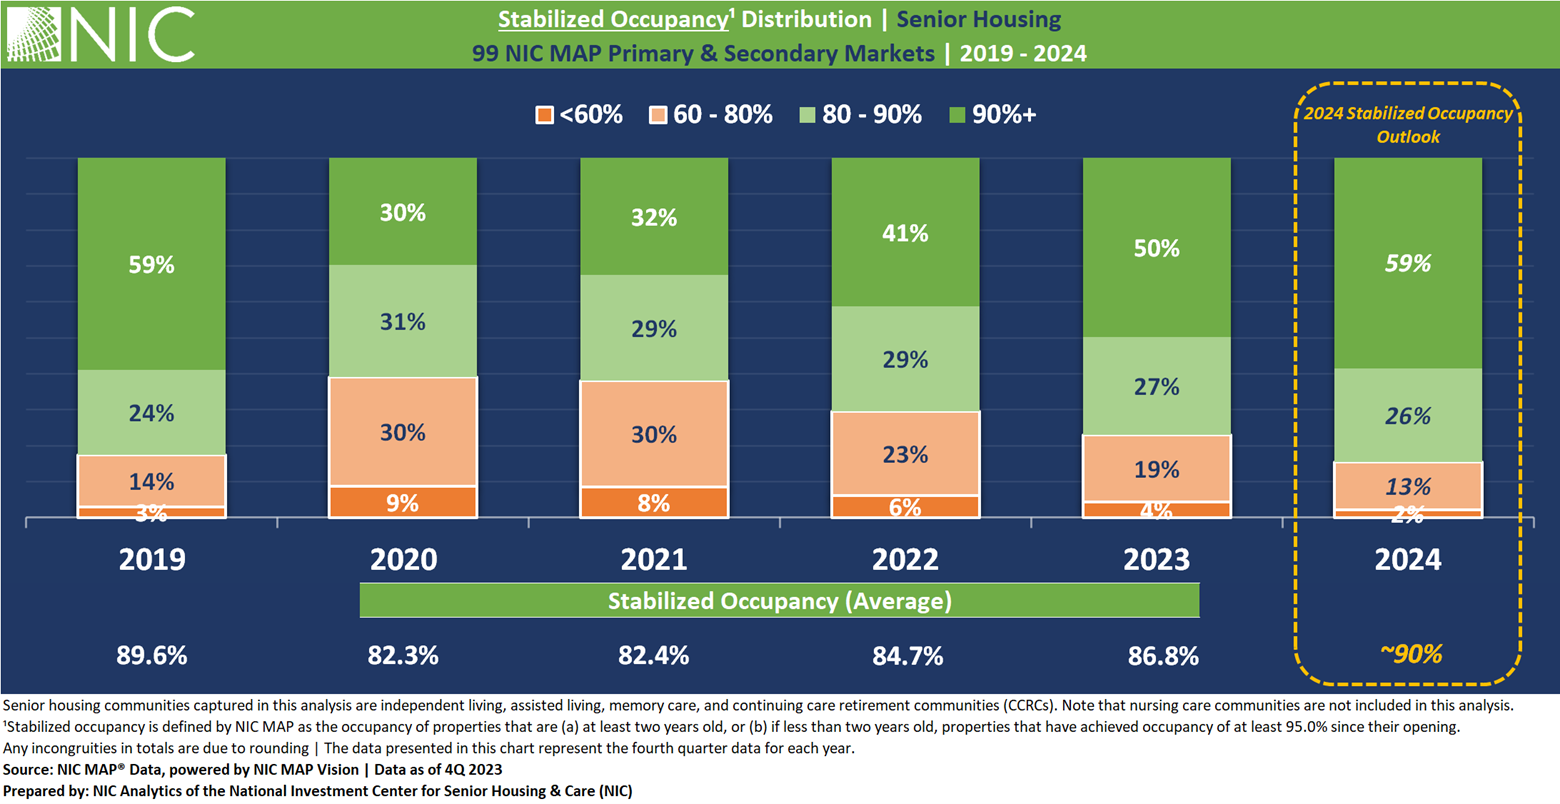
2024 Stabilized Occupancy Outlook: Average and Distribution.
In 2019, prior to the onset of the pandemic, 17% of senior housing communities in the 99 NIC MAP Primary and Secondary markets had stabilized occupancy below 80%. While the sector has made notable strides in occupancy recovery and is on record to return to and surpass pre-COVID occupancy levels by the end of 2024 on average, there remains a group of communities that continue to face challenges.
Specifically, 23% of senior housing communities are still reporting occupancy rates below 80% as of the fourth quarter of 2023. Such stabilized occupancy levels below 80% are likely to pose challenges, particularly given the current capital market conditions and the resulting lending environment as well as higher operating costs.
The NIC Analytics outlook for 2024 suggests a notable improvement in the overall stabilized occupancy distribution by the fourth quarter. Notably, 85% of senior housing communities are expected to have occupancy levels of 80% or higher by the fourth quarter of 2024, slightly exceeding the share seen in fourth quarter 2019. In contrast, 13% are expected to remain within the 60–80% occupancy range, while another 2% are expected to have occupancy below 60%.
By the fourth quarter of 2024, the stabilized occupancy rate for senior housing communities in the 99 NIC MAP Primary and Secondary Markets is expected to reach approximately 90% on average.

Capitalizing on 2024 to Increase Occupancy and Align with the Broader Trend of Occupancy Recovery
Since the first quarter of 2020, NIC Analytics has been tracking the recovery of stabilized occupancy across the 99 NIC MAP Primary and Secondary Markets by looking at the share of “same-store” senior housing communities that have achieved pre-pandemic stabilized occupancy levels and those that are still in the process of recovery. Same-store is defined as senior housing communities that have been open and reporting data at least since 1Q 2020. Within the 99 Primary and Secondary Markets, a total of 7,521 same-store senior housing communities were identified. Closed and newly opened properties since 1Q 2020 have been excluded from this second part of the analysis.
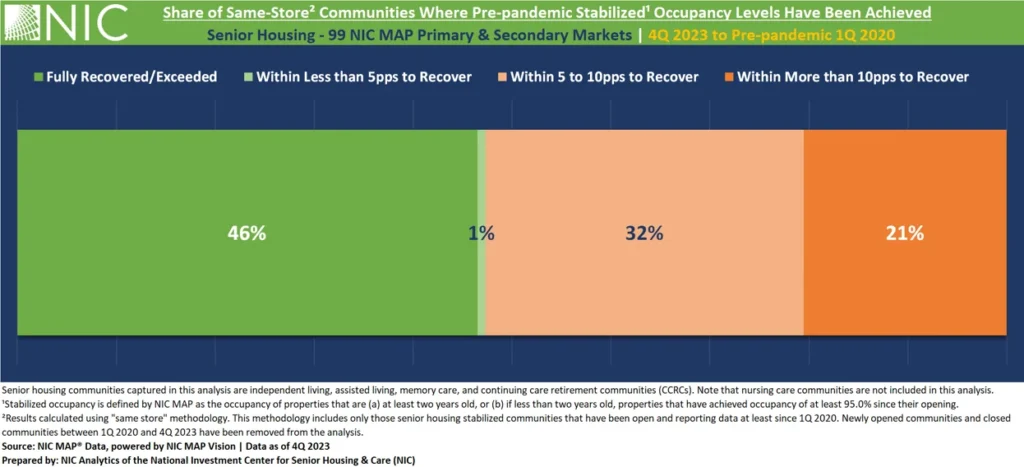
The exhibit below shows that 1Q 2020 stabilized occupancy levels have been achieved or surpassed as of 4Q 2023 in nearly half (46% – equivalent to 3,500 communities) of same-store communities within the 99 Primary and Secondary Markets. Additionally, a marginal 1% of communities are within less than 5 percentage points (pps) of returning to their pre-pandemic occupancy rates.
By contrast, as of 4Q 2023, roughly one third of communities (more than 2,400) still lagged behind their 1Q 2020 stabilized occupancy levels, with a 5 to 10pps range of recovery. Additionally, 21% of communities (more than 1,500) still have a gap of over 10pps to bridge in order to reach 1Q 2020 occupancy levels.
While each of these communities faces its unique set of challenges contributing to a slow recovery process, overarching challenges and opportunities emerge at the market level.
Competition from New Entrants: The emergence of newly opened communities presents competition, capturing a portion of the market share and potentially prolonging the occupancy recovery process for some stabilized communities.
Leveraging Favorable Market Dynamics to Increase Census: Amidst record levels of demand and moderate new supply expected to continue through 2024, senior housing communities with lagging occupancy rates are presented with a prime opportunity to capitalize on market dynamics and enhance census and occupancy levels.
While currently construction starts are low and inventory growth remains moderate, consensus suggests a regained pace by the end of 2024. Consequently, competition from newly opened properties is expected to grow.
2024 presents a golden opportunity to increase occupancy amid favorable market dynamics.

Download the 2023 NIC Stabilized Occupancy Stratification Report
¹Stabilized occupancy is defined by NIC MAP as the occupancy of properties that are (a) at least two years old, or (b) if less than two years old, properties that have achieved occupancy of at least 95.0% since their opening.
