Skilled Nursing Occupancy Continued Increase in August 2022

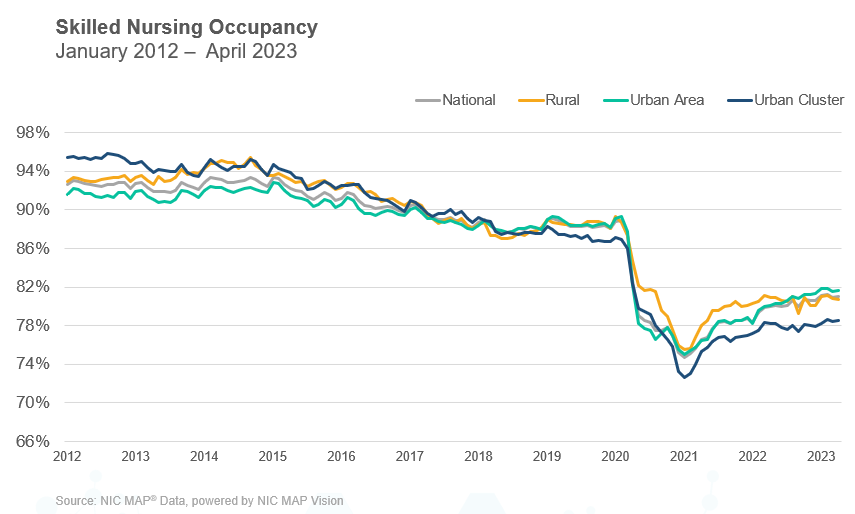
NIC MAP Vision released its Skilled Nursing Monthly Report on November 3, 2022, including key monthly data points from January 2012 to August 2022.

“Occupancy has increased throughout 2022, which suggests demand for skilled nursing is growing. However, retaining adequate staff is still challenging and limits the ability to increase patient admissions.”

-Bill Kauffman

NIC MAP Vision released its latest Skilled Nursing Monthly Report on November 3, 2022. The report includes key monthly data points from January 2012 through August 2022.

Here are some key takeaways from the report:

Skilled nursing occupancy continued to increase in August, rising 48 basis points from July to end the month at 78.8%. This is the highest occupancy rate since April 2020. There has been positive occupancy momentum throughout 2022 and it is up 580 basis points since the low point reached in January 2021 (73.0%). However, COVID-19 cases created additional challenges last year (2021), which slowed some of the initial momentum and the staffing crisis in the sector is still a significant burden on skilled nursing operators. Occupancy remains 8.4 percentage points below the pre-pandemic February 2020 level of 87.2%. As staffing, wage growth, and general inflation pressures persist, operations for many operators will be under pressure but the long-term demand for skilled nursing services is expected to grow over time.

SNF Blog Slides Aug 2022_Final_Page_15While Medicare revenue mix and the revenue per patient day both increased in August, they are down from earlier in the year. In January and February of 2022, increased cases of COVID-19 resulted in additional need for utilizing the 3-Day rule waiver and per day reimbursement for COVD-19 positive patients. Indeed, Medicare revenue mix ended August at 22.0% but is down from its pandemic high of 24.9% set in February 2022. Medicare RPPD is down 2.9% from its pandemic peak of $590 in June 2020. Meanwhile, Managed Medicare revenue mix was down 15 basis points to 10.4% in August. However, this is 229 basis points above the pandemic low of 8.1% set in May 2020.
SNF Blog Slides Aug 2022_Final_Page_13

Managed Medicare revenue per patient day (RPPD) decreased in August and is down 1.2%% from year-earlier levels. Depending on an operator’s business model, the continued decline in managed Medicare revenue per patient day can pose a challenge as the reimbursement differential between Medicare fee-for-service and managed Medicare has increased during the past two years. However, some operators see opportunity to capture patient volume with the growth of managed care. Medicare fee-for-service RPPD ended August 2022 at $573 and managed Medicare ended at $453, representing a $120 differential. In August of 2020, the differential was $105.

After decreasing slightly in the month of July, Medicaid patient day mix increased 23 basis points ending August at 64.9%. However, it has increased 252 basis points from the pandemic low of 62.4% set in February 2022. Meanwhile, Medicaid revenue mix declined 25 basis points from the prior month, ending August at 50.8%. One element of the Medicaid revenue share of a property’s revenue is RPPD and that declined 0.33% from July. However, it up 0.8% since last year in August 2021.

Get more trends from the latest data by downloading the Skilled Nursing Monthly Report. There is no charge for this report.

The report provides aggregate data at the national level from a sampling of skilled nursing operators with multiple properties in the United States. NIC continues to grow its database of participating operators to provide data at localized levels in the future. Operators who are interested in participating can complete a participation form on our website . NIC maintains strict confidentiality of all data it receives.

Economic Uncertainty Clouds Outlook

The U.S. economy holds both upside and downside risks that will impact the senior housing and care industry in the near term.

Better Times Expected as Baby Boomers Start to Arrive

The U.S. economy holds both upside and downside risks that will impact the senior housing and care industry in the near term. Inflation is high, labor costs are up, and the price of capital is rising. But low unemployment, moderate growth in consumer spending, and a recent uptick in GDP are relative bright spots.

Higher interest rates should help prevent overbuilding. Looking beyond the next 24-36 months, owners and operators should benefit as demand increases with the arrival in 2026 of the first baby boomers to turn 80.

Economic forecaster Jason Schenker mapped out the state of the economy and what’s ahead during the keynote address at the 2022 NIC Fall Conference. Attendees packed the ballroom to hear his remarks at the Marriott Marquis, Washington D.C. The Conference was held September 14-16, drawing more than 2,800 attendees.

2022 NIC Fall Conference Schenker 1 600x300

In a “noisy” economy where predictions fluctuate daily, Schenker gave his remarks in mid-September. He noted at the time that the economy faced more downside than upside risks.

Inflation continues to be a big risk. The annual inflation rate was 8.2% at the end of September, compared to 8.3% the previous month, according to the U.S Labor Department. “The inflation rate is (closest to) the highest it’s been since 1981,” said Schenker, founder of Prestige Economics and chairman of The Futurist Institute.

Employment costs were up 5.7% year-over-year in the second quarter of 2022. Added to that, workers are switching jobs. A report by the Pew Research Center shows that from April 2021 to March 2022, 60% of those who left their jobs for a new company saw real wage gains. Only 47% of those who took a new job at their present company saw real wage gains. “You have to work elsewhere to beat inflation,” said Schenker. “That’s scary when you’re thinking about your staffing needs.”

Wages are not going to retreat. The labor market is a seller’s market, a situation Schenker expects to continue for a while.

The Impact of Inflation

In an effort to curb inflation, the U.S. Federal Reserve has raised interest rates by 3 percentage points since last March, when the rate was near zero. Schenker anticipates more hikes before the end of the year. The Federal Reserve is expected to raise rates again on November 2.

“Will the Fed’s policy work?” asked Schenker. Inflation will remain “sticky” for a while despite the Federal Reserve’s aggressive policies, he said. Geopolitical risks such as the war in Europe and a worldwide rise in energy prices are out of the control of the U.S. central bank.

Rising interest rates are slowing the housing market, a big concern for senior housing owners and operators whose residents often sell a house to move into a retirement community.

Mortgage rates topped 7% at the end of October. Demand for mortgages and home prices are falling. On the plus side, mortgage delinquency rates remain relatively low.

Lending for commercial real estate is also feeling the pinch of higher interest rates and greater caution on the part of lenders. This is translating into slower transaction volumes and was apparent in third quarter data from NIC MAP Vision. Transaction volumes totaled $1.1 billion on a preliminary basis for senior housing and care in the third quarter, the weakest quarterly volume since early 2010.

2022 NIC Fall Conference Schenker 2 600x300

Winning Strategies

Looking ahead, Schenker emphasized the positive impact of demographics as aging baby boomers require senior housing and care services. “You will have a never-ending stream of potential residents,” said Schenker. He added that high interest rates are likely to constrain new construction which means there will be more demand for senior housing than the available supply can accommodate.

Several challenges also lie ahead. Medicare faces insolvency in 2026 and Social Security in 2034. Healthcare costs continue to outstrip inflation. The healthcare workforce shortage is not expected to ease. In fact, 5 of the top 10 sectors expected to have the highest job growth are in healthcare, including the personal care aides who work in assisted living. About 1.1 million new workers will be needed in the sector by 2030. “The demand is monstrous,” said Schenker.

Technology will play a role to fill the worker shortage in senior living. Wearable tracking devices can help monitor residents. Automated drug dispensers can improve efficiency and reduce the risk of medication errors. But Schenker doesn’t think robot caregivers in the home will replace the need for assisted living anytime soon. “That will take a long time,” he said.

In conclusion, Schenker asked, “What are the winning strategies for the economic uncertainty we face?” His recommendation: “Focus on ROI,” quickly adding that the only two ways to boost net income are to sell more or spend less.

Schenker also suggested some approaches. Revisit vendor agreements. Raise rents. Be cautious about speculative investments. Focus on operational resilience. “Stick to the fundamentals,” he said.

Schenker warned that the next 2-3 years will be tough as inflation and worker shortages continue to impact the sector. But owners and operators should also plan for the future when there will be a limited number of facilities and more demand for senior living. “Looking beyond the immediate challenging period there is upside opportunity,” he said.

California’s Middle-Income Population Projections

The analysis revealed several key findings about the potential unmet needs of California’s middle-income seniors.

Building upon the groundbreaking “Forgotten Middle” study and its subsequent update, NORC at the University of Chicago recalibrated a nationally representative forecast of the 2033 middle-market population to produce estimates reflective of future California residents. The analysis revealed several key findings about the potential unmet needs of California’s middle-income seniors, including:

  • The middle-income senior population in California will increase to 1.6 million in 2033 (+60%). Notably, the number of middle-income seniors aged 85 and older in the state is expected to double, from 230,000 to 463,000.

NORC Forgotten Middle CA - Findings_Page_16 V2

While the middle-income senior population is expected to grow substantially in the next decade, only a portion will be able afford the projected cost of private-pay assisted living. With the annual out-of-pocket price point of assisted living and medical care in California at $75,000, even with housing equity, more than half (821,000) of middle-income seniors in California will likely not have the financial resources to afford them. Without housing equity, nearly 90% are projected to struggle with covering the cost of private assisted living over the next decade.

By reducing the potential price point of assisted living, the potential market size expands. If operators can reduce the price point of assisted living by $10,000, an additional 209,000 Californians – an increase of over 25% – would then have the resources available to afford that product.

  • By 2033, 58 percent of California’s middle-income seniors will be unmarried, and 43 percent may not have children living within 10 miles.

NORC Forgotten Middle CA - Findings_Page_13

Having spousal support enables many people to stay in their homes longer and means assets and financial resources remain pooled together. Having children nearby means an increased likelihood of being able to utilize family caregivers. But as people have fewer children – and those children are increasingly less likely to live nearby – this solution becomes harder to make a reality.
These demographic shifts result in fewer available caregivers, which we know as a national ratio falls from seven adult children (aged 45 to 64) to care for one parent over 80 years old to four-to-one in 2030 and three-to-one in 2050.

  • One in five middle-income seniors in California will have cognitive impairments or high needs. A majority will have three or more chronic conditions and mobility limitations.

NORC Forgotten Middle CA - Findings_Page_12

The study also found that most of California’s middle-income seniors are likely to develop multiple chronic conditions and mobility limitations in the next decade, making it challenging for them to live independently.

Additionally, researchers with NORC at the University of Chicago have created illustrative case studies that underscore and help provide examples of the impact these findings have for Californians. View the complete slide deck of findings, including methodology, key findings, case studies, and information on the “near dual” seniors cohort who are close to Medicaid eligibility.

NIC MAP Vision 3Q22 Key Takeaways: Senior Housing Occupancy Rate Rose Full Percentage Point

NIC MAP Vision clients, with access to NIC MAP® data, attended a webinar in mid-October on key senior housing data trends during the third quarter of 2022.

NIC MAP Vision clients, with access to NIC MAP® data, attended a webinar in mid-October on key seniors housing data trends during the third quarter of 2022. Findings were presented by the NIC Analytics research team. Key takeaways included the following:

Takeaway #1: Seniors Housing Occupancy Rose a Full Percentage Point in 3Q 2022

  • The occupancy rate for seniors housing—where seniors housing is defined as the combination of the majority independent living and assisted living property types—rose 1.0 full percentage point to 82.2% from the second quarter of 2022 to the third quarter of 2022 for the 31 NIC MAP Primary Markets. This marked the sixth consecutive quarter where occupancy did not decline. At 82.2%, occupancy was 4.3 percentage point above its pandemic-related low of 77.9% recorded in the second quarter of 2021 but was still 5.0 percentage points below its pre-pandemic level of 87.2% of the first quarter of 2020.
  • Demand as measured by the change in occupied inventory or net absorption was very strong in the third quarter, increasing by 8,719 units in the Primary Markets. This was the strongest demand ever recorded by NIC MAP Vision except for the post-pandemic boost in demand seen in the third quarter of 2021 (11,922 units). 
  • Since the recovery began in second quarter 2021, 43,319 units of the 45,707 units placed back on the market have been re-occupied, or 95% of those units.

Takeaway #2: Occupied Units for Assisted Living Hit All-time High

  • It’s notable that the total number of occupied units reached a new high in the third quarter for Assisted Living, rising to 268,787 units. This was more than 1,600 units higher than the pre-pandemic first quarter 2020 level.
  • This was not the case for Independent Living, where more than 4,000 units need to be occupied on a net basis to reach pre-pandemic occupied unit counts.
  • This speaks to the value proposition of Assisted Living and its appeal to families that need the services and amenities offered to older adults. That said, the socialization aspect of Independent Living is attracting new residents after the long-extended pandemic related period of isolation for so many older adults.

Takeaway #3: Occupancy Recovery Well Underway, but More Room to Go

  • The graph below helps to provide perspective on the pace of recovery to date for each property type and how far they must go to get back to pre-pandemic 1Q 2020 occupancy levels.
  • For Senior Housing, occupancy had fallen 9.3 percentage points from its peak of 87.2% in the first quarter of 2020 to its nadir of 77.9% in the second quarter of 2021 and has since recovered 4.3 percentage points to reach 82.2% in the third quarter of this year. This means that another 5.0 percentage points of occupancy must be recovered.
  • The strongest recovery to date has been Assisted Living. Overall, occupancy is up 5.6 percentage points from its low point of 81.6%, but it remains 4.9 percentage points below its Q1 2020 pre-pandemic level of 84.6%.
  • At 84.7% in the third quarter of 2022, Independent Living occupancy was 3.0 percentage points above its low point, but remained 4.9 percentage points below its pre-pandemic peak, the same as for Assisted Living.
  • And lastly, Nursing Care occupancy fell a very large 12.6 percentage points and has thus far recovered 5.3 pp of occupancy, but it remains furthest behind its pre-pandemic occupancy at 79.3%, with a 7.3 percentage point gap.

FINAL 3Q22 Webinar_Page_13

Takeaway #4: Construction Activity Still Slow in Most Markets

  • The heat map below shows which metropolitan markets are experiencing the most construction activity. The generally blue tones on the right side of the chart indicate that construction activity is relatively “cool” in many markets.
  • Looking at the right-hand part of the grid, those markets that are shaded brighter red are seeing the most construction as a share of inventory. This includes Miami, Portland, San Jose where construction as a share of inventory amounted to 11.0% in the third quarter.
  • At the other end of the spectrum are markets where there is very little construction underway; this includes Pittsburgh, San Antonio, San Francisco, all less than 1%.
  • For perspective, for senior housing, this equals 5.0% of inventory for the Primary Markets and it peaked at 7.3% in late 2019.

FINAL 3Q22 Webinar_Page_25

Takeaway #5: Transaction Volumes Weak Through the Third Quarter

  • Total transaction volumes equaled $5.9 billion through the third quarter of 2022. In the third quarter alone, there were $1.1 billion of deals closed. If the third quarter figure were to hold, volume would be down 63% from the much stronger showing in the second quarter of $3.0 billion and it would be the weakest quarterly volume since the first quarter of 2010! Note that this data does not include deals that have been announced, only closed transactions and it is preliminary data. However, the data and certainly anecdotes, indicate that momentum in the transactions market has slowed sharply.
  • Indeed, there is much conversation of buyers becoming more hesitant as the cost of debt increases significantly and therefore changes the investment return expectations and underwriting models, including the price buyers are willing to pay. In addition, there has been much discussion about deal delays as banks become more cautious due to the capital market volatility, rising interest rate markets and uncertainty about pricing.
  • In terms of the buyers, the third quarter was again dominated by the private buyers and that has been the case for quite some time, although 2021 did see some public REIT activity.
  • Of the $1.1 billion closed in the third quarter, private buyers represented $637 million of that, or 57% of the closed volume in the third quarter. Public buyers represented 20% and institutional buyers accounted for 17%.
  • Private capital has been a steady source of capital for many years, especially the private partnerships and family regional owner/operators that have been a steady source of liquidity. However, we are now coming into a different paradigm in terms of the real estate investment markets as interest rates and inflation continue to pressure overall liquidity and it will be interesting to see if private capital continues to dominate over the next few quarters.

Interested in learning more?

  • While the full key takeaways presentation is only available to NIC MAP clients with access to NIC MAP data, you can access the abridged version of the 3Q22 Data Release Webinar & Discussion featuring my exclusive commentary below.
  • View the Abridged Slides Presentation.

Executive Survey Insights Wave 46: September 19 to October 16, 2022

Increased acuity of residents at move-in is reported across all care segments but the most cited challenge facing operators is rising operator expenses.

“Increased acuity of residents at move-in is being reported across all care segments, driven by delayed move-ins, but the most cited challenge facing operators – reported by more than 90% of respondents in the Wave 46 survey – is rising operator expenses. Responses to questions on property and professional liability insurance provide additional insight into that sentiment.

Just under one-tenth of respondents reported the degree of staffing shortages across their organization to be severe, representing the lowest share of respondents reporting severe staffing shortages in the time this question has been asked. Though labor challenges persist, this may represent a glimmer of relief to the longstanding staffing crisis. Further, the survey results indicate that rent concessions are being offered at fewer properties now than was the case in earlier parts of 2022.”

–Ryan Brooks, Senior Principal, NIC

This Wave 46 survey includes responses from September 19 to October 16, 2022, from owners and executives of 58 small, medium, and large senior housing and skilled nursing operators across the nation, representing hundreds of buildings and thousands of units across respondents’ portfolios of properties. More detailed reports for each “wave” of the survey and a PDF of the report charts can be found on the NIC COVID-19 Resource Center webpage under Executive Survey Insights.
Wave 46 Chart Pack_Final_Page_06

The trend for rent concessions in the last three waves of the survey which this question was asked is that rent concessions are being offered at fewer properties now than was the case in earlier parts of 2022. Organizations offering rent concessions in all of their properties fell to a mere 7%, down from 21% in Wave 41 and 17% in Wave 37. Comparatively, organizations offering rent concessions in up to 25% of their properties rose to 50%, up from 29% in Wave 41 and 20% in Wave 37.

In the Wave 46 survey, 41% of respondents reported offering rent concessions. This is down from 46% in Wave 41 and 47% in Wave 37. Of organizations who are currently offering rent concessions, the most common forms being offered are free rent for a period of time (37%), rent discounts (24%), unit upgrades (18%), rent freezes (no increases for a specific period of time) (8%), and a reduced entrance free (8%).
Wave 46 Chart Pack_Final_Page_09

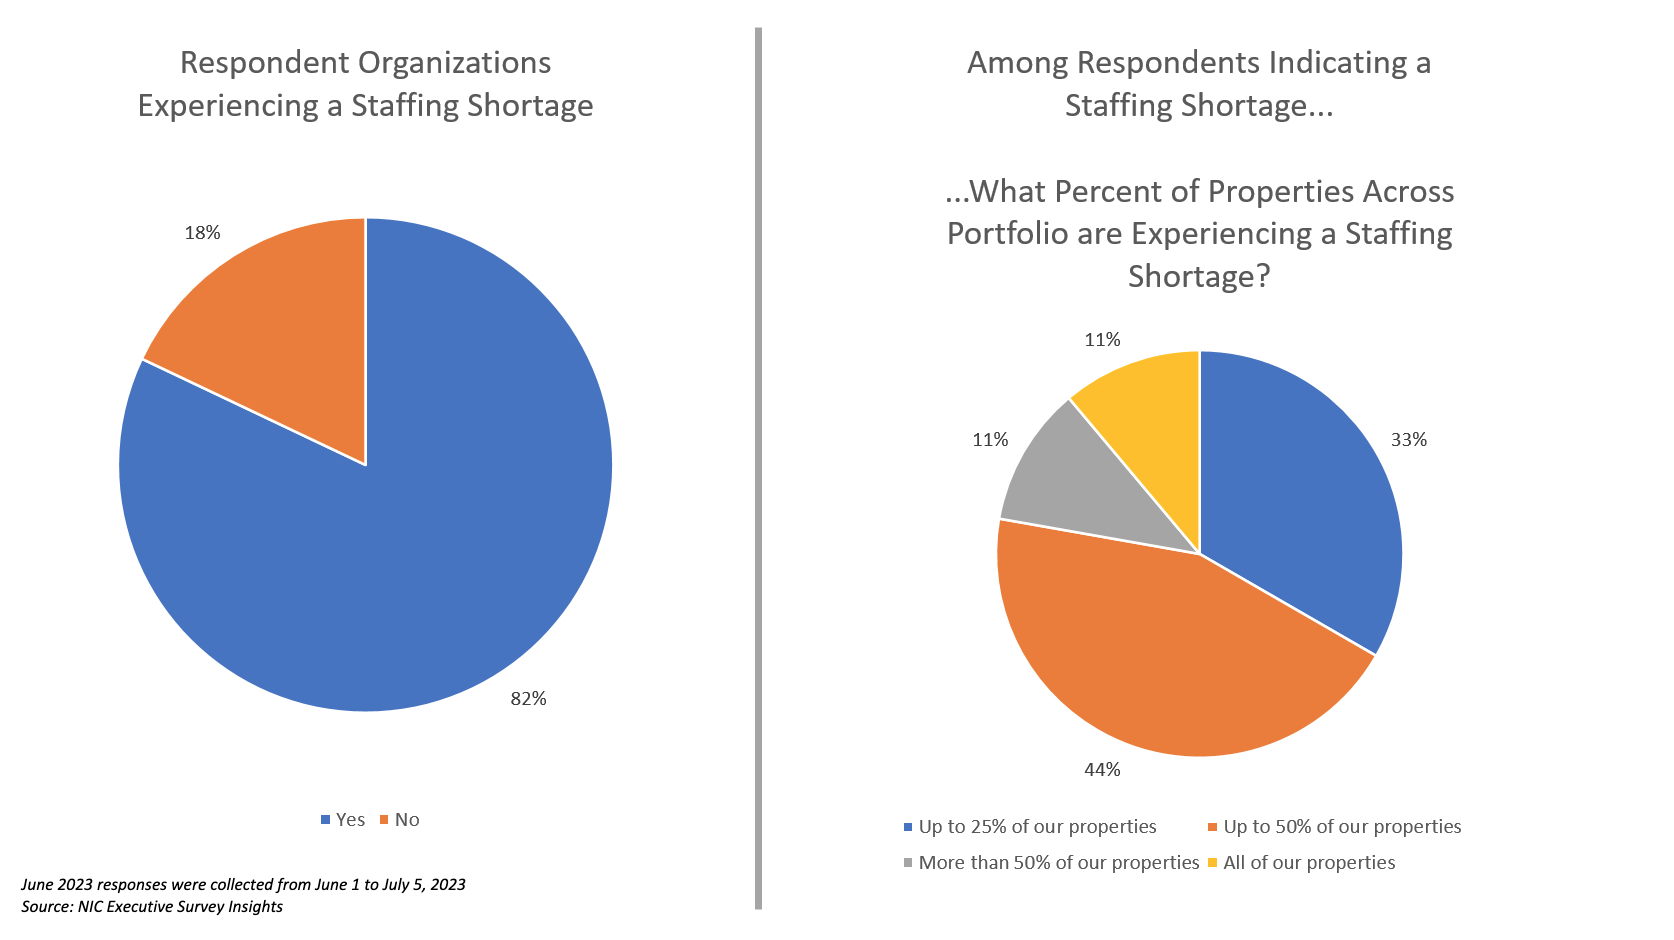
In the Wave 46 survey, one-tenth of respondents (9%) report staffing shortages at their organizations to be severe. This is down from one-fifth of respondents in the Wave 42 survey conducted in June 2022 and one-quarter of respondents in the Wave 39 survey conducted in March 2022. Conversely, one-fifth of respondents (19%) report the staffing shortages at their organizations to be minimal, which is up from 9% in Wave 42 and 6% in Wave 39. This represents both the highest share of respondents reporting minimal staffing shortages and the lowest share of respondents reporting severe staffing shortages since March 2022, which marked the beginning of the time frame in which this question has been asked.

While this may represent a promising sign of relief, staffing and labor challenges do persist. Despite fewer reports of severe staffing shortages, attracting community and caregiving staff is the second most cited challenge operators are facing (79%) followed by staff turnover (67%). Having to limit admissions due to staffing shortages was also reported by 24% of operators.

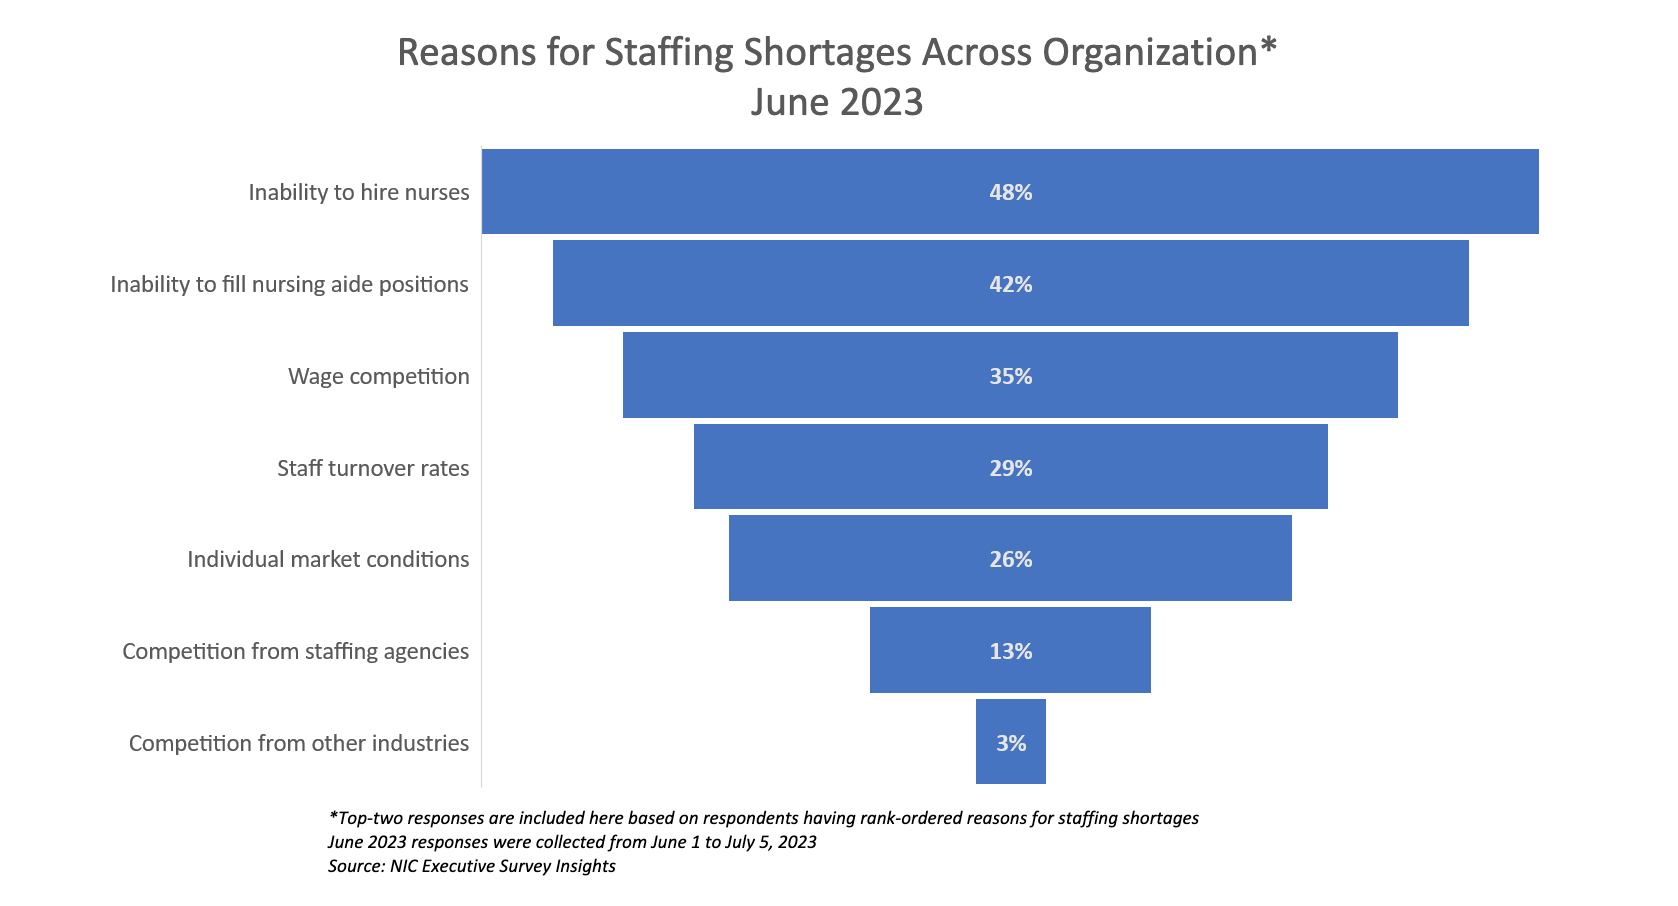
When asked what the staffing shortages at their organization are due to, the most common response was competition from other industries (25%), followed by an inability to hire nurses (21%), competition from staffing agencies (17%), and an inability to fill nurse aide positions (15%).

Wave 46 Chart Pack_Final_Page_11

The most cited challenge facing operators – reported by more than 90% of respondents in the Wave 46 survey – is rising operator expenses and responses to questions on property and professional liability insurance emphasize the sentiment.

When asked to compare the cost of their property insurance currently to pre-pandemic, between 82% and 84% of operators across all care segments – independent living, assisted living, memory care, and nursing care – reported it to have increased (either significantly or slightly). Two-fifths of independent living operators report the change in the cost of their property insurance to have increased significantly, followed by nursing care (38%), assisted living (30%), and memory care (25%).

Wave 46 Chart Pack_Final_Page_12

Professional liability insurance has also increased compared to pre-pandemic. When asked to compare the cost of their professional liability insurance to pre-pandemic, two-thirds (68%) of memory care and assisted living (66%) operators report the change in cost to have either increased significantly or increased slightly, followed by 58% of independent living operators, and one-half (52%) of nursing care operators. No owners or operators reported a decrease in the cost of professional liability insurance.

Market conditions, overall macroeconomic environment, inflation, COVID-19, and insurers dropping out of the market resulting in less competition are all among the reasons cited by respondents for the increase in property and professional liability insurance.

Wave 46 Chart Pack_Final_Page_08

The Wave 46 survey asked respondents whether they found the acuity of new resident move-ins to have increased, decreased, or stayed the same as compared to before the pandemic started. Increased move-in acuity was reported by two-thirds (65%) of assisted living operators, 53% in memory care, 50% in nursing care, and 48% in independent living.

Wave 46 Chart Pack_Final_Page_04

In the Wave 46 survey, reflecting operator experiences in September and the first half of October 2022, the rate of operators reporting an increase in the pace of move-ins in the past 30 days held steady for assisted living properties (43%), memory care properties (46%), and nursing care properties (28%). The rate of independent living operators reporting an increase in the pace of move-ins in the last 30 days rebounded to 43%, compared to 29% in Wave 45.

Wave 46 Chart Pack_Final_Page_05

Most survey respondents reported no change in the pace of move-outs across all care segments within the past 30 days, a consistent theme for the most recent four ESI Waves. In Wave 46, 76% of independent living operators, 67% of assisted living, 76% of memory care, and 76% of nursing care operators reported no change in the pace of their move-outs.

Wave 46 Survey Demographics

  • Responses were collected between September 19 and October 16, 2022, from owners and executives of 58 senior housing and skilled nursing operators across the nation.
  • Owners/operators with 1 to 10 properties comprise roughly two-thirds (64%) of the sample. Operators with 11 to 25 properties account for 19%, and operators with 26 properties or more make up the rest of the sample with 17%.
  • More than half of respondents are exclusively for-profit providers (57%), just over one-third operate not-for-profit seniors housing and care properties (34%), and 5% operate both.
  • Many respondents in the sample report operating combinations of property types. Across their entire portfolios of properties, 79% of the organizations operate seniors housing properties (IL, AL, MC), one-fifth (22%) operate nursing care properties, and two-thirds (34%) operate CCRCs – also known as life plan communities.

This is your survey! Owners and C-suite executives of seniors housing and care properties, please help us tell an accurate story about our industry’s performance. While some standard questions will remain for tracking purposes, in each new survey wave, new questions can be added based on respondents’ suggestions. Please let us know what you think.

Wave 47 of the ESI is now live. The current survey is available and takes ten minutes to complete. If you are an owner or C-suite executive of seniors housing and care and have not received an email invitation to take the survey, please contact Ryan Brooks at rbrooks@nic.org to be added to the list of recipients.

NIC wishes to thank survey respondents for their valuable input and continuing support for this effort to provide the broader market with a sense of the evolving landscape as we recover from the pandemic.