The funeral home industry is losing sales.
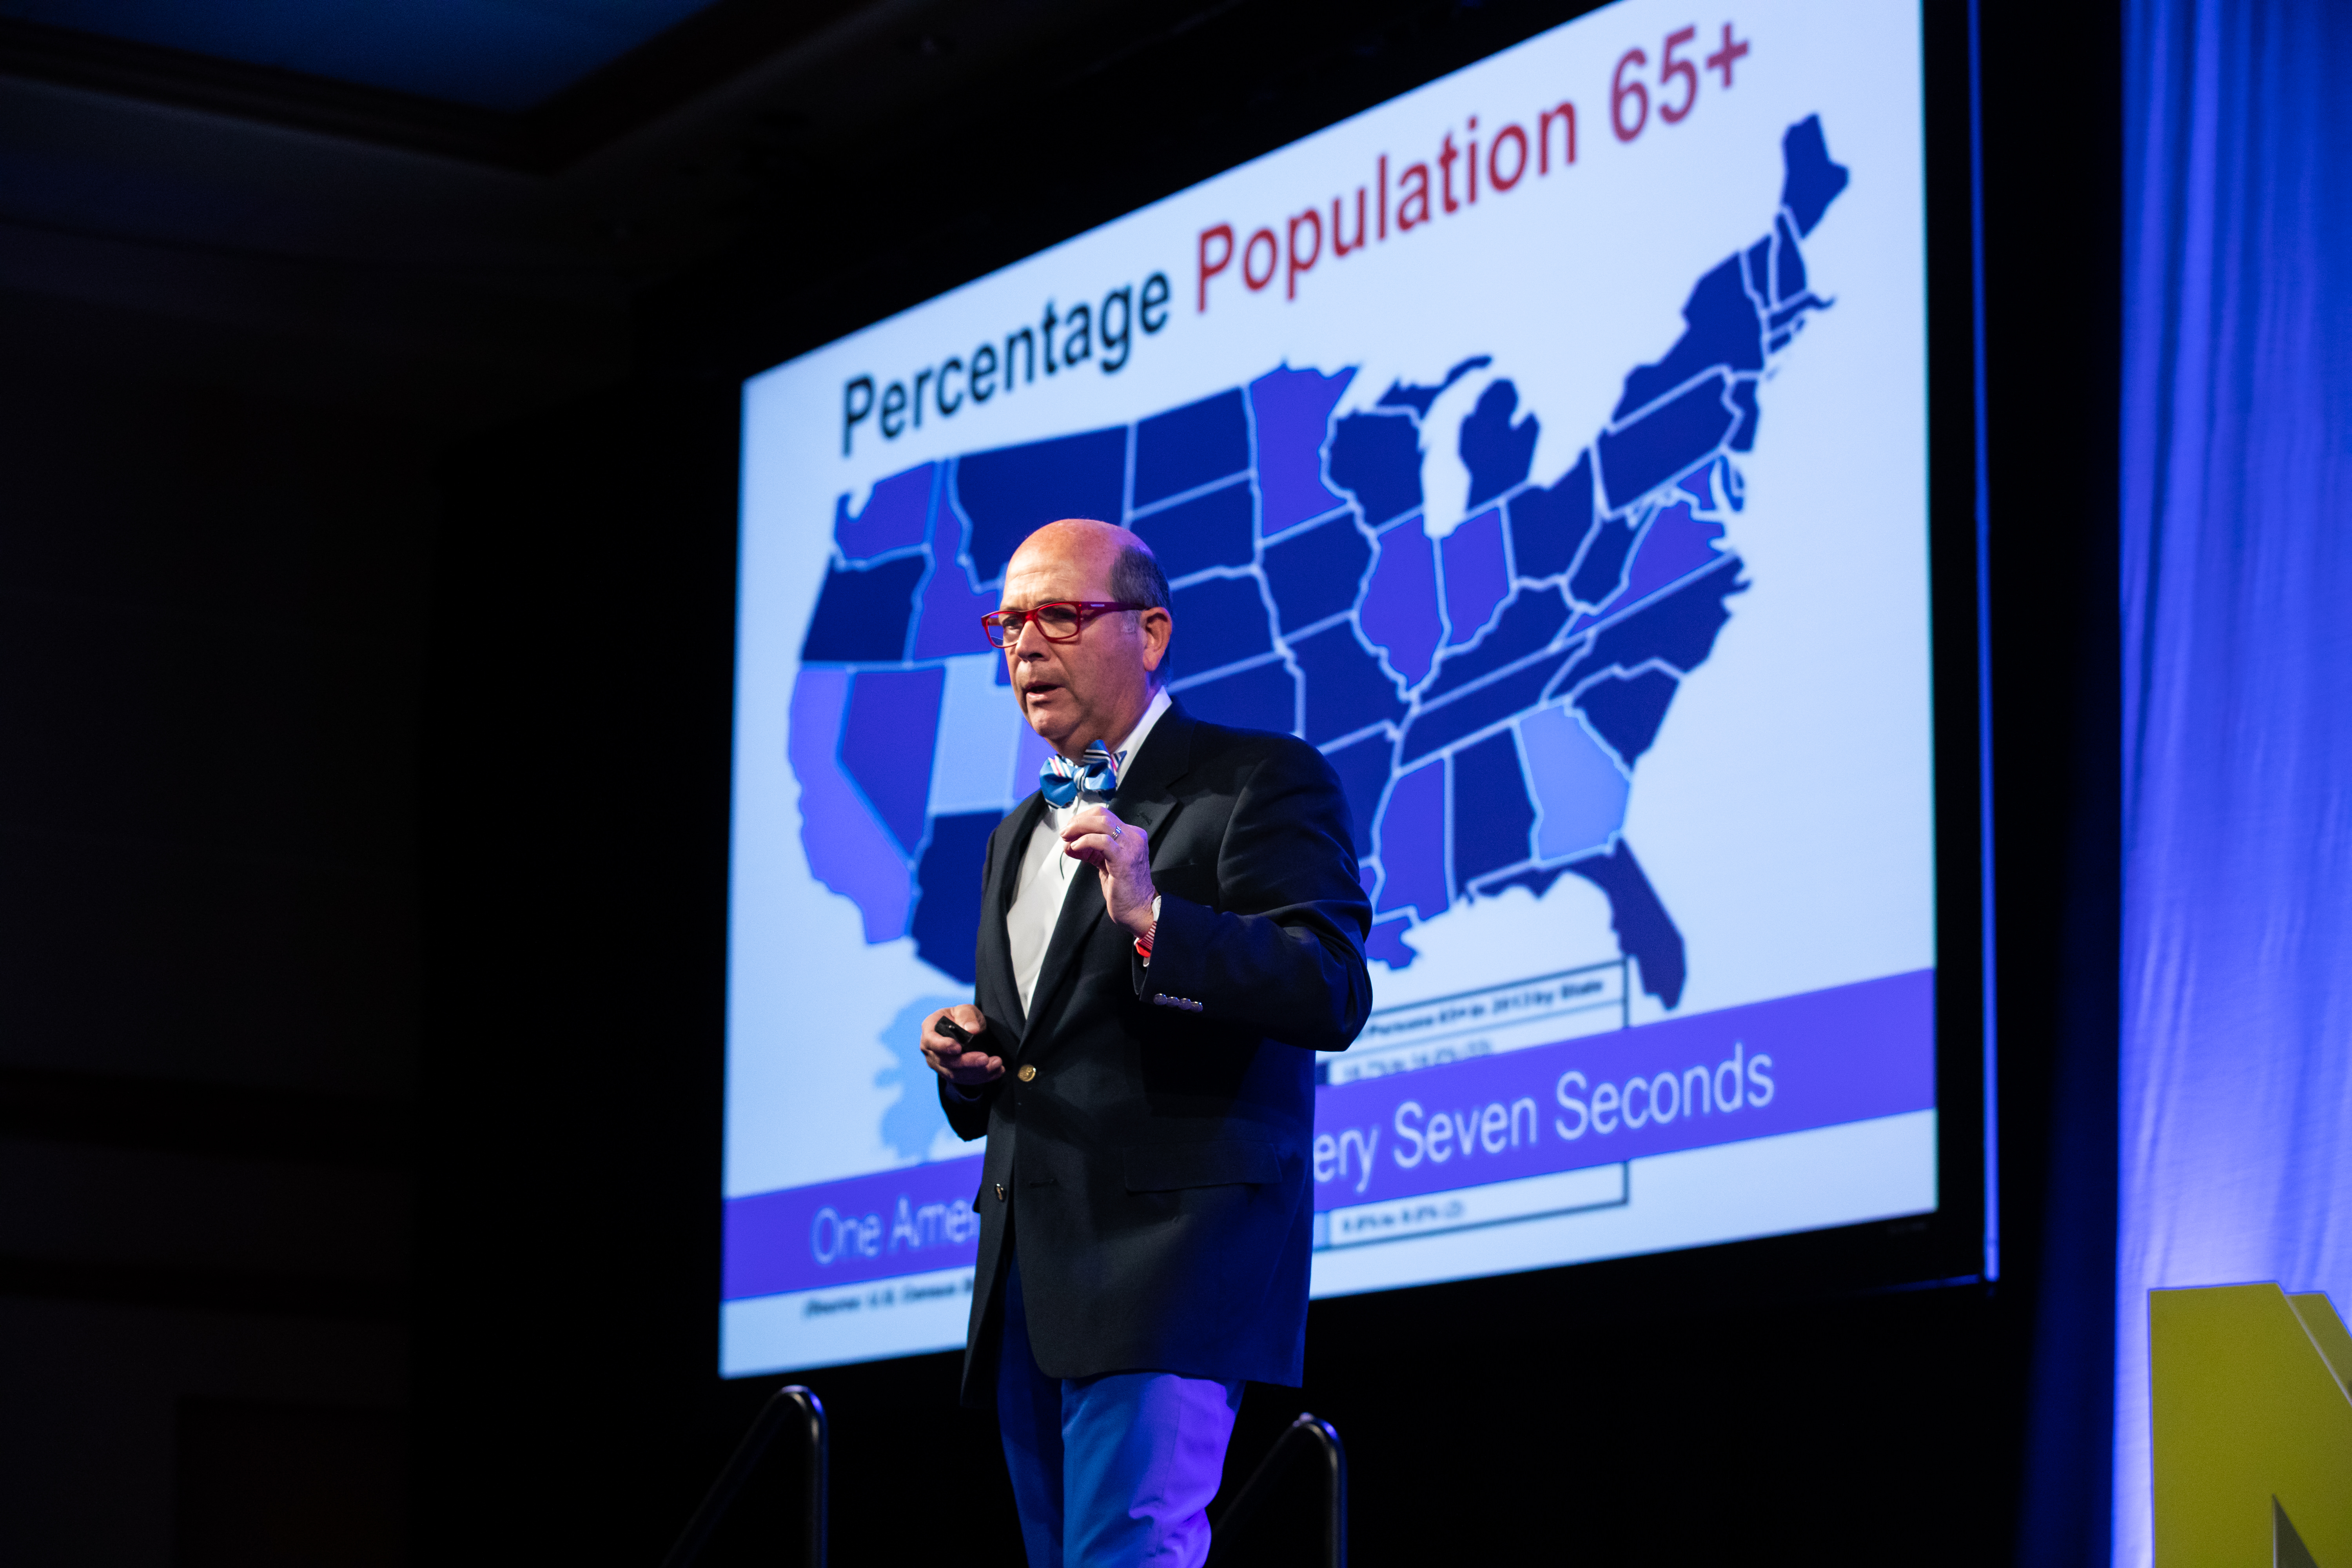
This was just one insight into the “longevity economy” that attendees of the NIC Fall 2019 Conference were treated to during an enlightening keynote session by Dr. Joseph F. Coughlin, founder and director of MIT’s AgeLab.
Coughlin is a recognized thought leader specializing in the impact of demographics—particularly related to retirement, aging, and real estate.
“Longevity is changing how all of us live,” he said, as he asked the audience to focus on more than just the numbers behind changing demographics. Coughlin described the concept of disruptive demographics and how it will change the future of seniors housing. “The future of your business is not just more old folks. These folks are very different.”
Higher Expectations
The numbers and research are compelling, however.
- Ages 60+ make up the third largest economy in the world, next in line to the GDPs of the U.S. and China.
- In the U.S., those aged 50+ are responsible for 70% of the consumer spend.
- Sixty-four percent of those 65 and over believe their IQ is higher than average.
The next generation of seniors is more educated and more confident than prior generations, Coughlin noted. He believes this leads to higher expectations and ultimately to different desires for their seniors housing. The next generation will expect different and newer products than what worked for their parents.
8,000 Days
Coughlin told the audience to think about how they, as an industry, own a third of adult life, “Old age is longer than we think,” he said. He compared the span of retirement years—roughly ages 65-85, totaling about 8,000 days—to that of ages 0-21, and 21-midlife and noted the lack of defined stages or milestones in retirement. He presented his thoughts on four retirement “stories” encountered during this stage of life.
- Managing ambiguity. This is the point at which adults are deciding what comes next, whether it be full retirement, consulting, starting a business, etc. Coughlin noted that women over 50 are the second largest group starting new businesses.
- Managing big decisions. Older adults at one point will face larger decisions such as whether to downsize into a smaller home, relocate, retire completely, etc.
- Managing complexity. Complexities grow as older adults may begin to face medical problems, financial issues, and more.
- Managing living solo. Adjustments are needed as most older adults, particularly women, will end up living alone at some point.
Creating Communities
In general, Coughlin sees the current generation of adults entering retirement years eschewing participation in formal groups, such as joining a church or the rotary, and instead gravitating to lifestyles and ultimately housing based on smaller affinity groups, targeted to commonalities. He sees seniors moving to small towns and college towns for the informal communities and amenities available there.
“College communities form a virtual assisted living, if you will,” he said, noting the availability of entertainment, dining options, and even care at medical schools.
He pointed out that the “service-on-demand” apps and in-home technology popular with the millennial generation are life-changing for seniors too. Already, smart devices can be used to monitor medications, eating habits, and other health concerns. Services that started as conveniences are enabling seniors to stay safer in their homes for longer.
Users vs. Buyers
The baby boomer generation is not the audience for seniors housing yet, but they tend to be the decision makers for their parents’ selections. And buying decisions in general are made primarily by women. “The future is indeed female,” said Coughlin as he cited statistics showing that women are three times more likely to perform online research when making purchasing decisions. Women are now the primary decision makers for automobile purchases, consumer electronics, and health care products.
Looking to the Future
As providers look to the future, Coughlin recommends organizations work to become trusted members of the community so there’s a natural relationship. He sees an evolving notion of seniors housing in which care, community, and brick and mortar overlap with platforms, partnerships, and pipelines built on trusted relationships.
“The future of service and senior services is not a place,” said Coughlin, “it’s any place that person may live.”
###