Capital providers and operators are talking about the challenges and opportunities of serving middle-income Americans who will not be able to afford private-pay seniors housing and care at current price-points, yet also don’t qualify for government assistance. While the discussion has only just begun, it is already generating excitement amongst investors and operators, along with a host of new ideas, and an openness to innovation and new partnerships aimed at meeting a huge demand that will only grow over the next several decades.
Just a month after hosting an event in DC hosted by Health Affairs to publicly announce findings from “The Forgotten Middle: Middle Market Seniors Housing Study”, NIC released the full study to the public, and hosted an investor briefing and discussion in a special event at New York City’s Yale Club. Co-sponsored by Institutional Real Estate, Inc. (IREI) and Real Capital Analytics (RCA), the event featured insights from study authors, detailed data, and expert panel discussions aimed at inspiring discussion and interest amongst the capital providers who underwrite much of the seniors housing and care industry in the United States, as well as operators and developers in the industry.
Following an introduction and welcome given by NIC Chief of Research & Analytics Chuck Harry, NIC Chief Economist and Director of Outreach Beth Mace provided key findings and takeaways for capital providers and operators.
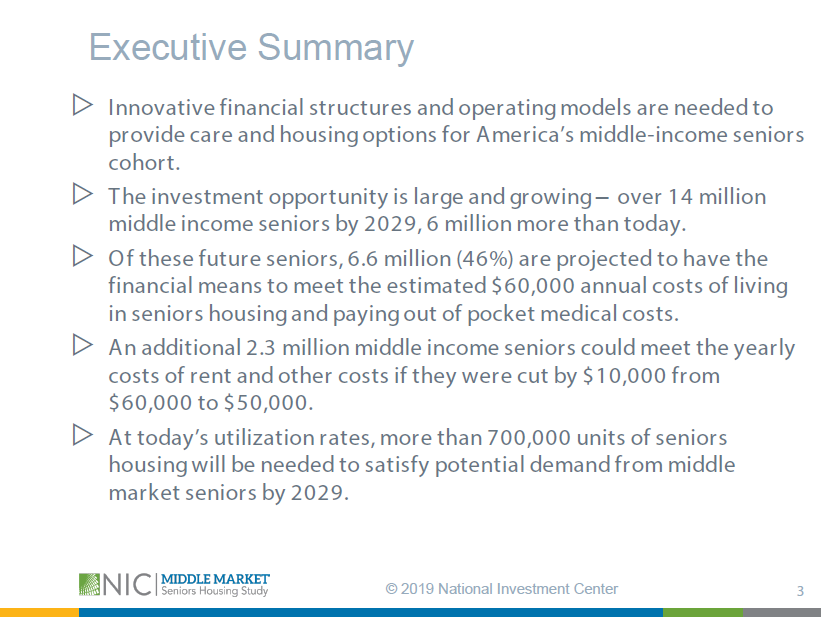
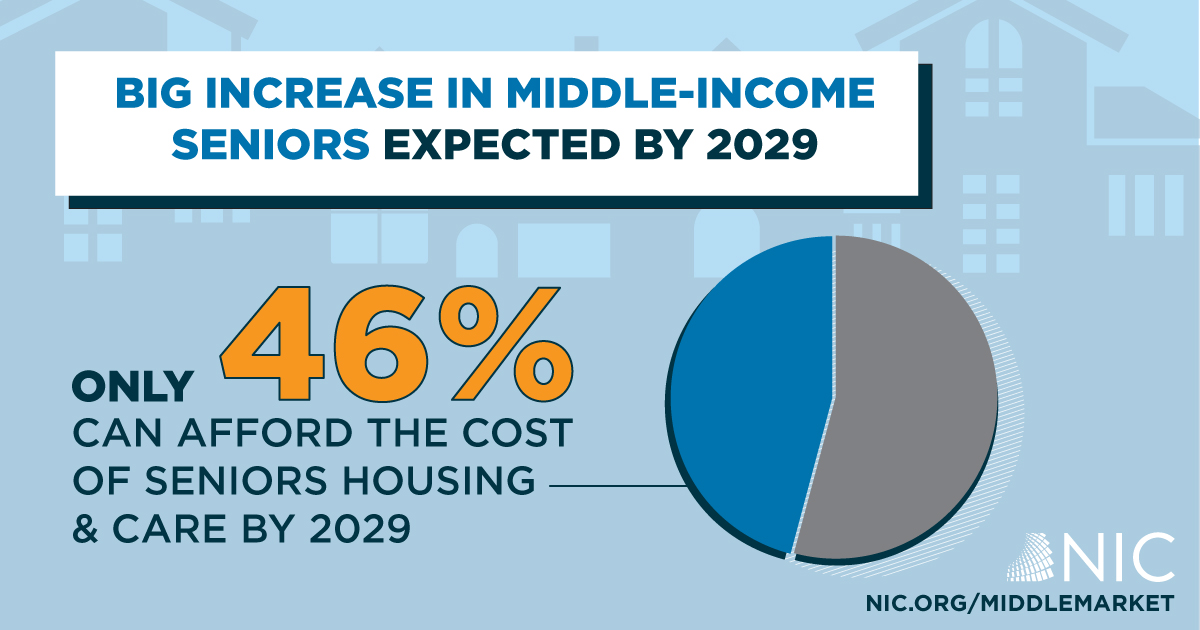
Mace’s summary of the study’s findings highlighted the challenges and opportunities facing the sector. She said “This investment opportunity is big. Our study indicates that there will be more than 14 million middle income seniors in 2029. That’s 6 million more than today.” She went on to explain that these numbers are conservative, and will actually continue to grow beyond 2029, and to point out that at today’s penetration rate of 11.2% and today’s construction rates, it would take 17 years to open the 700,000 new units it would take to meet this demand in 2029. After reviewing other key data points, Mace said that “the goal of today’s event, really, is to get the conversation started, to see how we, collectively as an industry, can start to address the care and housing needs of this cohort.”
Study author Caroline Pearson, Seniors Vice President of NORC at the University of Chicago, then provided insights into the potential for further study, down to the local level, which would be potentially very useful for investors. Referring to last month’s Health Affairs event, she said, “I was in awe of the response that we got from the policy community to the research. I’ve released a lot of research; people are always very kind and gracious and say, ‘thank you’ but the excitement in the room this time was palpable.” She closed by saying “I’m eager to hear the discussion today. I’ve received lots of questions from the press, and lots of people have said to me, ‘you’ve convinced us this is a really big problem. Now we’re really scared – what should we do about it?’”
What followed was a series of panel discussions, organized by industry perspectives, which yielded a host of ideas, plenty of questions from the audience of investors and industry leaders, and some general agreement on key issues that the sector will face, in an environment of cautious optimism.
The first of three panels, moderated by Mace, featured equity investment executives Pam Herbst, Managing Director, AEW Capital Management, and Andrew Brett, Director of Real Assets Research, NEPC. The discussion yielded numerous ideas that Herbst and Brett have considered – or would consider – for making seniors housing more affordable, while retaining viability as an investment for their firms and the industry.
The idea of shared space was raised, both as a means to lower construction and operating costs, and as a potentially attractive option for the boomer generation and seniors who might find a social living arrangement attractive. Reducing common areas from today’s average of 35%-40% would lower costs. Herbst also raised the possibility of gaining additional Floor-to-Area (FAR) allowances from municipalities in return for adding units to serve the middle market. This could help eliminate additional land basis costs, something she suggested could be relatively easy for communities to grant.
Other ideas the panel discussed included state and municipal tax grants and investment incentives, renovating and/or repurposing older buildings, such as malls and big box retail, reducing dining and labor costs through existing programs such as “meals on wheels”, and allowing younger volunteers to “bank” volunteer hours towards their own retirement.
The following panel, also moderated by Mace, was designed to represent the debt perspective. Panelists included Robert M. White, Jr., Founder and President, Real Capital Analytics, Michael Patterson, Vice President, Underwriting and Credit, Freddie Mac, Christopher Callaghan, Group Vice President, Head of Healthcare Banking, M&T Bank, and Heidi Brunet, Managing Director, Newmark Knight Frank.
White presented data profiling the recent history of debt financing in the sector, with his insights on who is providing debt financing and who is not, and who may be providing debt in future. Following this, the panel answered questions from Mace on their perspective – and their ideas on dealing with potential middle market investment.
When asked by Mace whether Freddie Mac would be able to securitize mortgages for lower margin housing and care models, Patterson said “we have obviously been able to so far…and we are wanting to continue doing that. We think this may be a part of those securitizations.”
Referring to the conversation around cost, Callaghan, whose bank underwrites seniors housing construction, said, “We can underwrite to a lower margin for permanent debt, and get comfortable with sustainable cash flows. The lower to moderate income seniors housing has margins that are half those of high-end seniors housing, but you can still underwrite those cash-flows.”
Ideas the panel discussed included adding Medicare reimbursements above rent, as the value-based care system begins to expand what the government will pay for, to include services such as providing nutrition, rehabilitation, and assistance with activities of daily living (ADLs). It was suggested that properties that provide multiple levels of care might benefit from numerous advantages. Also, the panel discussed the need for local and regional banks to be educated on the sector, to encourage further engagement. Another suggestion was to consider the growing sources of foreign capital interested in the sector.
A panel of operators included Thomas Grape, Chairman and Chief Executive Officer, Benchmark Seniors Living, Gaurie Rodman, Director, Development Services, Direct Supply, and Judy Marczewski, Chief Financial Officer, Leisure Care. Moderator Kai Hsiao, Chief Executive Officer, Eclipse Seniors Living, began the discussion by saying, “This is where the rubber meets the road now. The question is can we actually make this middle market operating model work.” Hsiao then pointed out that his panelists had all “dipped their toe” in the water of middle market and would share what they had experienced so far.
When asked about the decision to get into lower-cost private-pay seniors housing, Grape responded that, “we were drawn to it for the reasons that motivated the study, which is that we’ve seen rents and costs continually increase and knew that there was an unserved middle that we wanted to see if we could tap into.” Marczewski, who said her company was about to open their third middle market property, said that, “what we have done is build an efficient model for operating and for construction. I really think the last piece of that is coming up with the efficient capital structure. That’s what’s missing.”
Rodman said that, “for the middle market I believe the solution lies in looking at every layer of the development process and the operating process comprehensively, from the beginning.” She supported finding communities willing to work with developers with payments-in-lieu-of-taxes, increasing FAR, and leveraging infrastructure improvement taxes, as part of the land-selection process, in order to remove land basis costs.
In addition to the ideas that came from the previous panels, the operators contributed many of their own. Grape’s company found cost-savings by simply reducing the building size, having shared units, and he explained how reducing non-care staff was possible, as well as using wood frame construction instead of steel and concrete as a cost-savings measure.
Marczewski’s company lowered costs with efficient kitchen and menu design, resulting in high quality foods, but fewer options, and lower staff costs. Rodman described a cost-savings of $1,200 per unit just by replacing a closet that had a sprinkler in it with an armoire.
Other ideas the panel discussed included achieving more labor efficiency with a “generalist” model, partnering with multi-use partners and developers, incorporating smart technology, partnering with healthcare, and leveraging community resources such as high schools and universities for volunteer groups. Panelists also suggested working with Medicare Advantage plans, adopting “social” models that emphasize the appeal of common areas, and attracting investor interest from the healthcare sector.
The event concluded with remarks from NIC Founder and Strategic Advisor Bob Kramer, who challenged attendees and viewers to think about the day’s key takeaways, as well as to consider what was not discussed, and to take the discussion back to their own companies. He emphasized that, “As we look at 2029, this is a huge market, which, for the most part we’re not serving now. It’s going to grow exponentially in size.” He went on to point out that for 20 years beyond the study’s projections to 2029 the market will continue to grow.
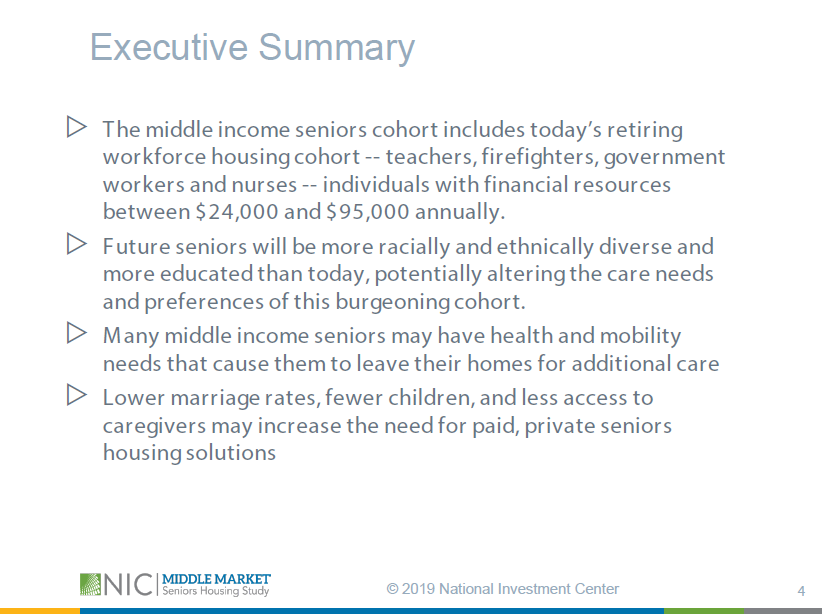
He discussed how demographics are changing, driving necessary shifts in how seniors housing must be conceived and marketed in the near future. Referring to aging baby boomers, he said, “they’re not going to want to move in to anything with the name ‘seniors’ on it, because they don’t want to be called a seniors.” Concluding his remarks, and the event, Kramer said, “We want to bring a spotlight to ideas, in terms of models…we’ve mentioned development efficiencies, we’ve talked about operating efficiencies, we’ve talked about capital efficiencies, and the last one…regulatory efficiencies – or I might say inefficiencies – but we need to put a spotlight on these and NIC wants to continue to do that.”
The invite-only event was live-streamed and is available on video, along with access to the study itself and many related resources, at https://www.nic.org/middlemarket-resources.

 NIC is pleased to announce that Dr. Janet Yellen, the first-ever woman to be appointed chair of the Board of Governors of the Federal Reserve System, will address the opening general session of the 2019 NIC Fall Conference at 8:00 AM on Thursday, September 12.