While the industry scratches its collective heads trying to figure out what baby boomers want in a senior living community, millennials are pointing the way.
The two groups have a lot in common. Baby boomers and millennials currently represent the largest cohorts in the American population, 74 million and 71 million respectively.
Baby boomers are the parents of millennials and share many of the same values that shape their housing preferences. They’re both more interested in having experiences rather than accumulating things. They want to make a difference too.
“Compare the values of someone 62 and someone 26, and they’re very much the same,” said Lilian Myers, an expert on aging and co-founder of EconomyFour, a social impact company based in Washington, D.C. “Both groups are interested in exploring what’s next.”
Myers has built a career around looking at the trends that shape our views of technology and of aging. As a serial entrepreneur she helped launch several health technology start-ups. She eventually moved on to work for IBM, initially consulting with global clients on the digital transformation of healthcare.
A project in Japan that linked isolated seniors by iPad to services from the postal service led her to become IBM’s global leader for aging and the longevity economy, conducting seminars on several continents to find industry solutions for age and longevity. “What it taught me was how universal and institutionalized age bias has become,” said Myers.
The age of 65 began to be attached to decline and need of help only a century and a half ago as industrial era social safety nets were established, said Myers. Today older adults are better defined by their vitality than their age. “Boomers aren’t using traditional definitions of who is considered old,” she said. “It’s more about how we feel, and we don’t feel old. We’re working, starting new businesses, and giving back in ever-greater numbers.”
Likewise, millennials are defying expectations. Many millennials, for example, are digital nomads, working remotely from anywhere without a formal office. They can travel and work, settling for months at a time in one place they like.
The idea can be applied to baby boomers who might like a living arrangement where they can continue to work remotely and live where they want. Myers herself is a bit of a digital nomad, working remotely from her condo in Florida when she’s not on the road.
The idea of digital nomads fits neatly with concept of portable living arrangements which are growing in popularity. At the NIC Spring Conference, attendees conducted a hackathon to brainstorm ideas for senior living communities that would appeal to baby boomers. A common feature of the communities was a portability component. One proposed project gave residents the ability to travel and live in different communities around the world.
New alternatives
Millennials like the idea of coliving, an idea that might also appeal to baby boomers, said Myers. For example, Roam is the global coliving and coworking community that combines work, travel and adventure. The website promises, “Strong, battle-tested wifi, a coworking space, chef’s kitchen and a diverse community.”
Another emerging housing alternative is the modern micro apartment. These tiny, fully-equipped urban units are well suited to those who want to switch cities easily without being tied down by a lot of things they have to move.
Millennials prefer urban spaces to the suburbs and so do a growing number of baby boomers. The city offers the advantage of walkable neighborhoods near services, parks and entertainment. No one needs a car.
Senior living providers have been trying to cram everything into one building adding a hip bistro or coffee shop, said Myers. “It makes more sense to simplify operations and build partnerships that surround the resident in the way universities have for students.” Urban locations already have everything built in.
Other trends are shaping housing choices. Like millennials, many boomers prefer living in a community with a multi-generational population. Both groups also want to stay connected without being walled off or being dependent.
As a self–described optimist, Myers believes the coming generation of 45, 50, and 60 year-olds will alter stereotypes about aging with the help of their younger counterparts. Myers stopped coloring her own gray hair when she noticed that young people in Asia and Europe were dyeing their hair white or grey. “It’s about stage, not age,” said Myers. “We’re looking for what’s exciting and what makes us feel connected, growing, and contributing in work, play, and relationships.”
###
May 10, 2019
janekadler@gmail.com

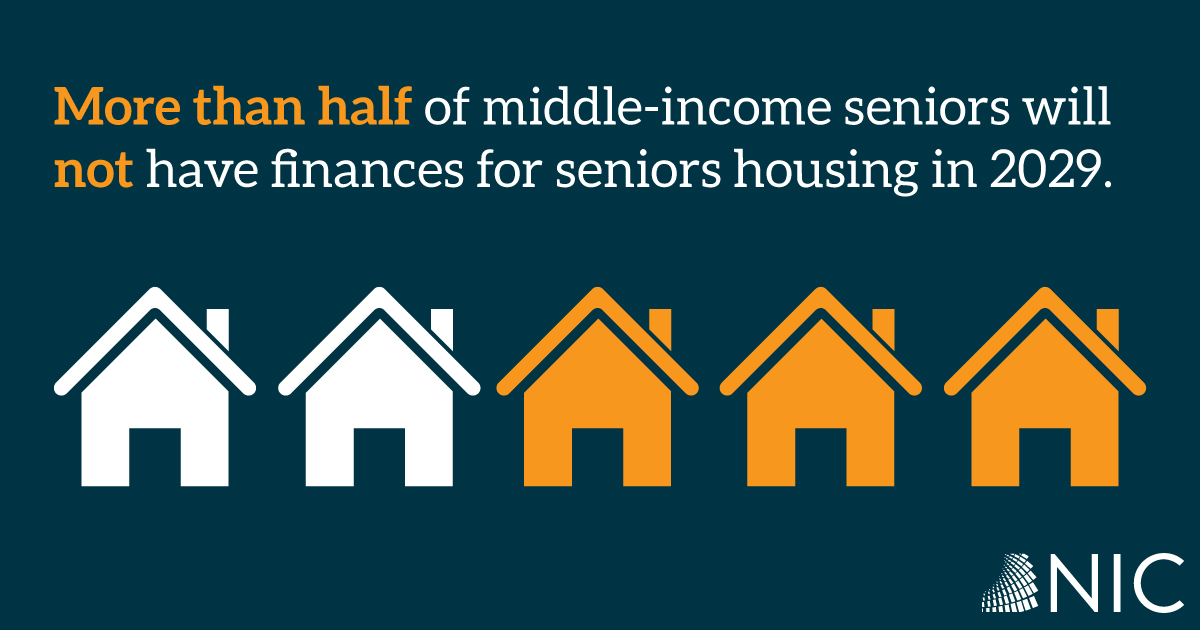
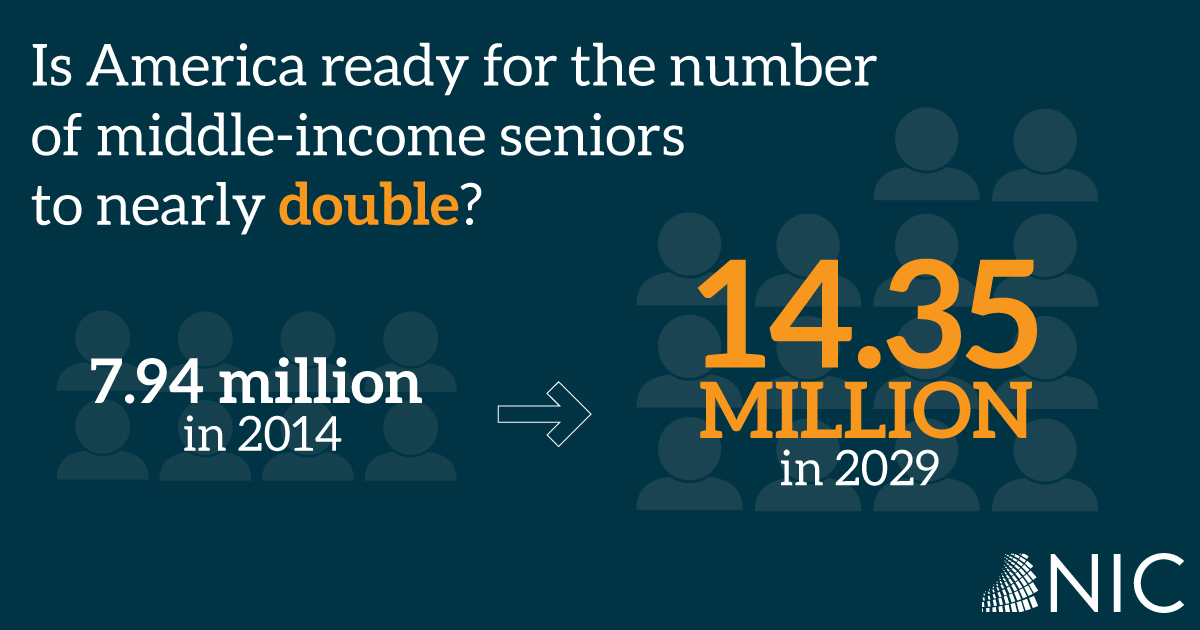
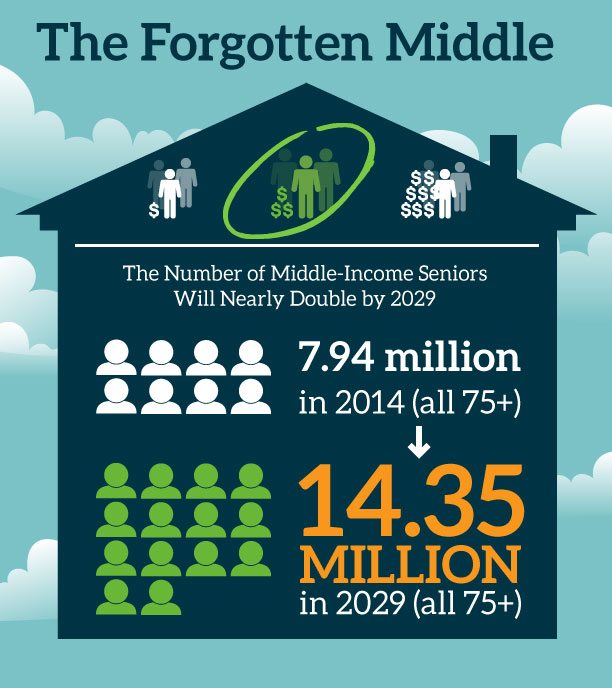 As Alan Weil, Health Affairs Editor-in-chief stated, “This is a pretty scary reality that’s coming towards us.” It was an appropriate sentiment, as the nation’s leading peer-reviewed health policy journal released a groundbreaking