NIC MAP® Data Service clients attended a webinar in mid-October on the key seniors housing data trends during the third quarter of 2018. Key takeaways included the following:
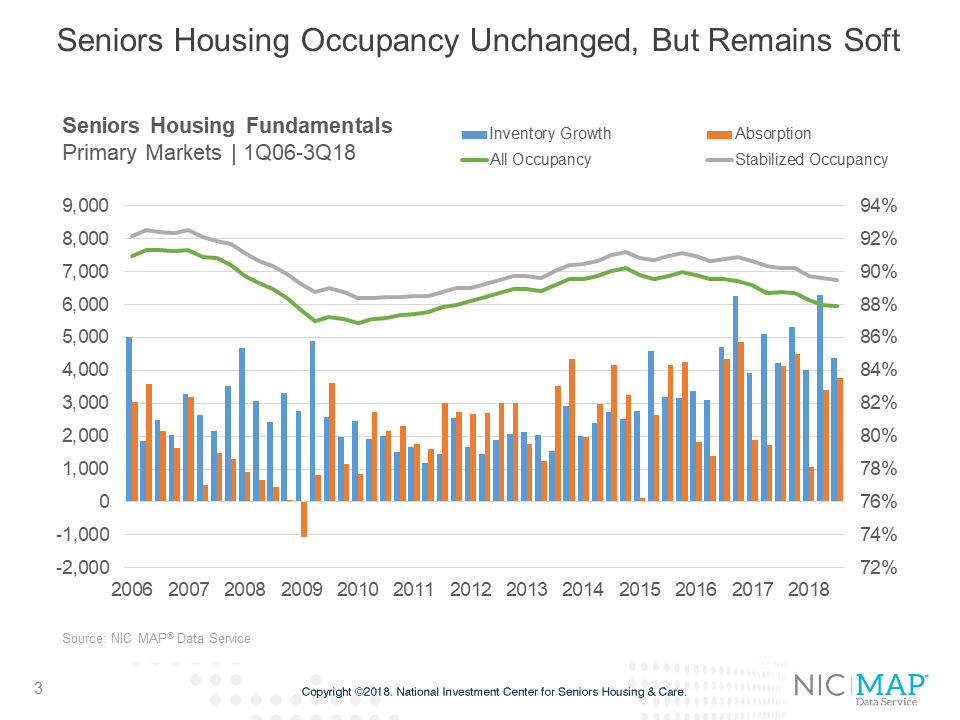
Takeaway #1: Seniors Housing Occupancy Unchanged, but Remains Soft
- The all occupancy rate for seniors housing, which includes properties still in lease up, was unchanged from the second quarter and remained at 87.9% in the third quarter, but this was down 80 basis points from the third quarter of 2017. This was the lowest occupancy rate in seven years or since 2Q2011.
- This placed occupancy 1.0 percentage points above its cyclical low of 86.9% reached during the first quarter of 2010 and 2.3 percentage points below its most recent high of 90.2% in the fourth quarter of 2014.
- During the quarter, 4,378 units were added to inventory, significantly less than the record pace of nearly 6,300 units seen last quarter and less than the pace of one year ago, but still a lot by historical norms. Net absorption totaled 3,765 units, up from the second quarter, but not as strong as one year ago.
- On a four-quarter moving sum, 19,981 units were added to the stock of seniors housing inventory in the past 12 months, not a record high, but close to the peak of 20,015 achieved in the second quarter of 2017. That represents a 3.4% increase in inventory in the past year.
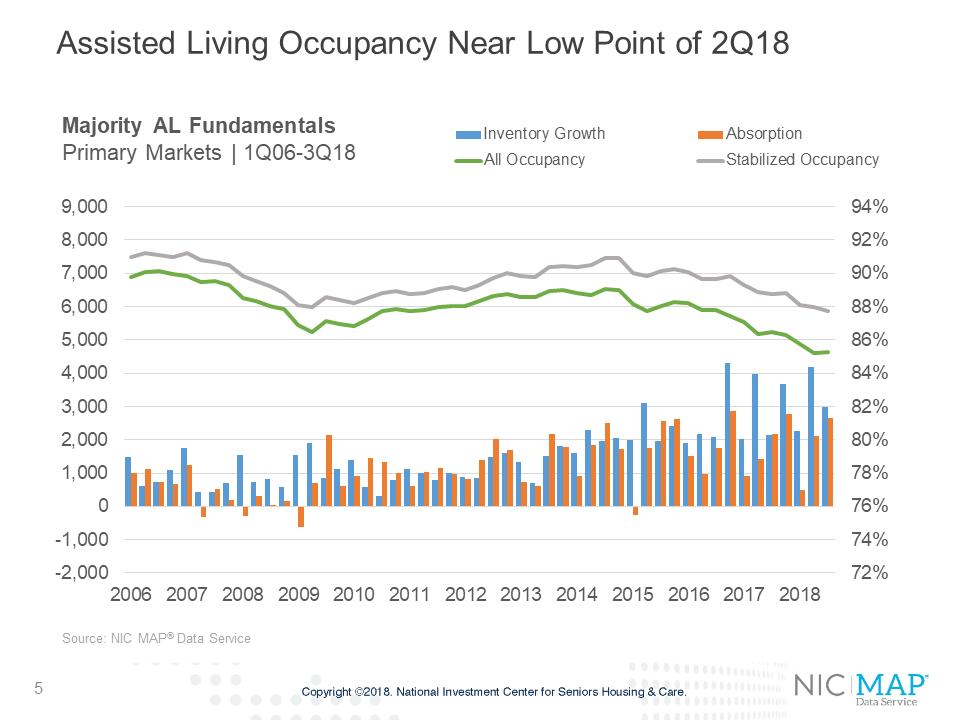
Takeaway #2: Assisted Living Occupancy Near Record Low Point of 2Q18
- Assisted living reached a near-record low occupancy rate of 85.3% in the third quarter. In the second quarter, the rate had reached an all-time low of 85.2%.
- There is a wide 250-basis point difference between stabilized and non-stabilized occupancy rates for assisted living. This stems from the large number of units that have come online but are not yet leased up. Based on data from NIC MAP Analyst report, there were 17,207 non-stabilized units in the third quarter, 6.2% of all inventory.
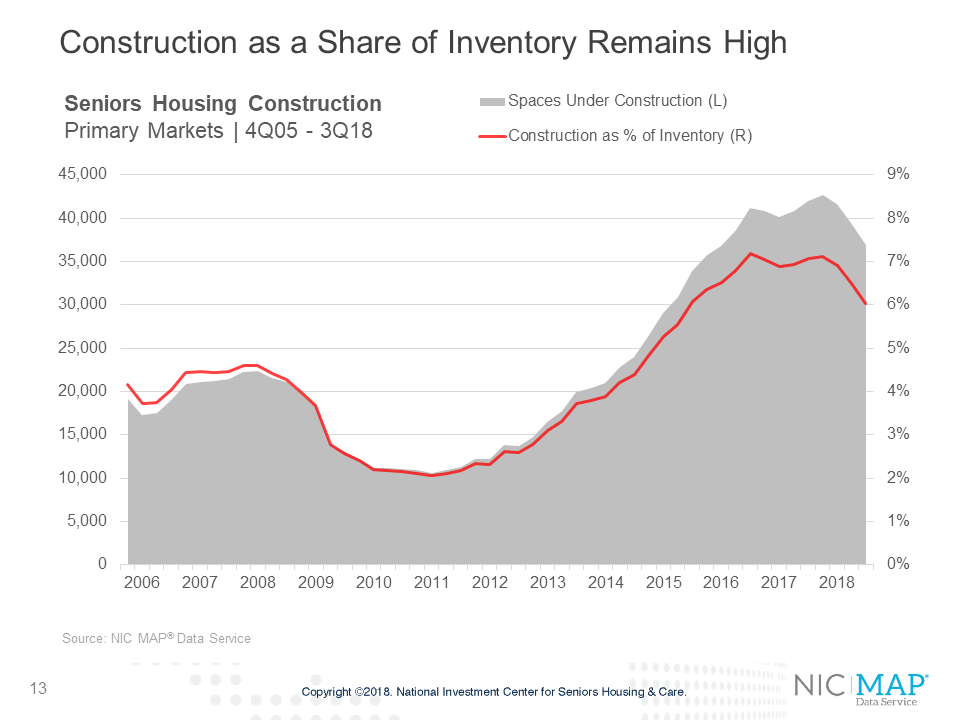
Takeaway #3: Construction as a Share of Inventory Remains High
- In the third quarter, an estimated 36,902 units were under construction in the Primary markets. This was the fewest units actively under construction since the first quarter or 2016, but still very high. This chart shows units under construction on the left axis and construction as a share of inventory on the right axis. Construction includes any project that has broken ground and has not yet been opened.
- As a share of inventory, these units represented 6.0% of today’s stock. This was below the four-time recent peaks of 7.0% or more seen in third and fourth quarters of 2016 and 2017.
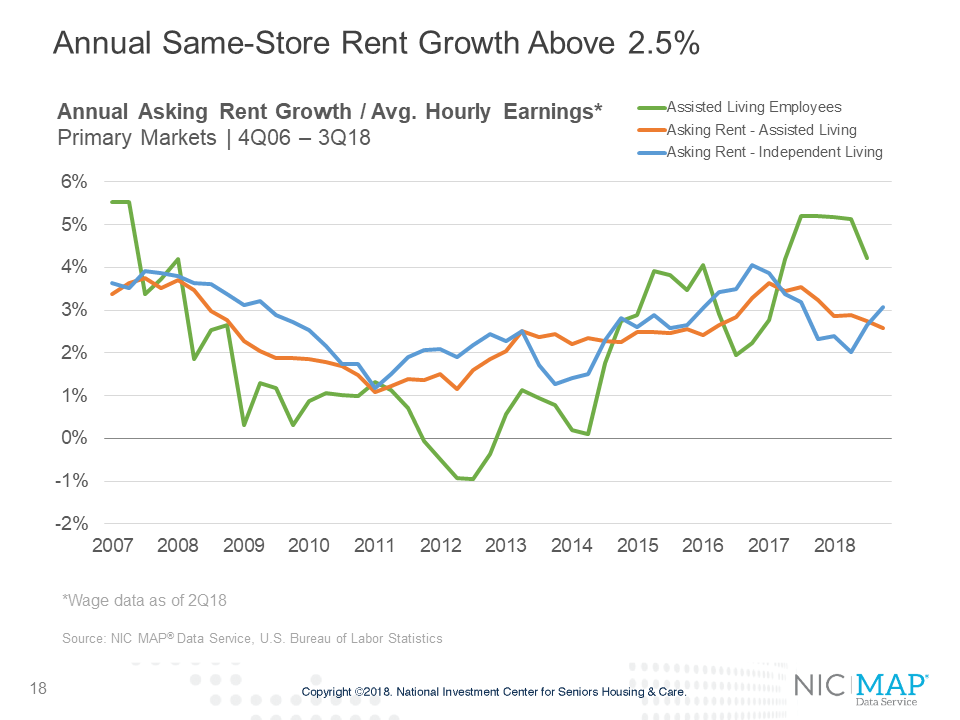
Key Takeaway #4: Annual Same-Store Rent Growth Above 2.5%
- Same-store asking rent growth for seniors housing accelerated in the third quarter, with year-over-year growth of 2.9%. This was up from 2.7% in the second quarter of 2018 but below the 3.8% rate it reached at the end of 2016.
- Asking rent growth for assisted living (orange line) was 2.6% for the third quarter, down 10 basis points from the second quarter. For independent living (blue line), rent growth accelerated back to 3.1% from 2.7% in the second quarter and 2.3% in the third quarter of 2017.
- This quarter, we’ve compared asking rent growth to the changes in average hourly earnings for assisted living workers, figures that are tracked and monitored by the U.S. Bureau of Labor Statistics. Average hourly earnings were up 4.2% for assisted living employees as of 2Q2018 Together, these lines show the pressure operators may be having as expense growth has been pressured higher, while rent growth has been easing. For many operators, labor expenses amount to 60% of their expenses.
- There is wide variation in rent growth, however. Among the Primary markets, the top ranked metropolitan areas for year-over-year rent growth were Portland Oregon (5.1%), San Jose, Seattle and San Francisco. Poorest rent growth was in Dallas, Kansas City, Cleveland and Atlanta.
Key Takeaway #5: Seniors Housing and Nursing Care Pricing Down in 3Q18
- Preliminary data for the third quarter shows that the rolling four-quarter price per unit for seniors housing was $159,700 in the third quarter, which is the lowest price per unit since the second quarter of 2014.
- For skilled nursing, the price per bed was an estimated $71,200 as of the third quarter 2018, which is down 15.3% from the prior quarter.


