U.S. Economy created 313,000 jobs in February 2018

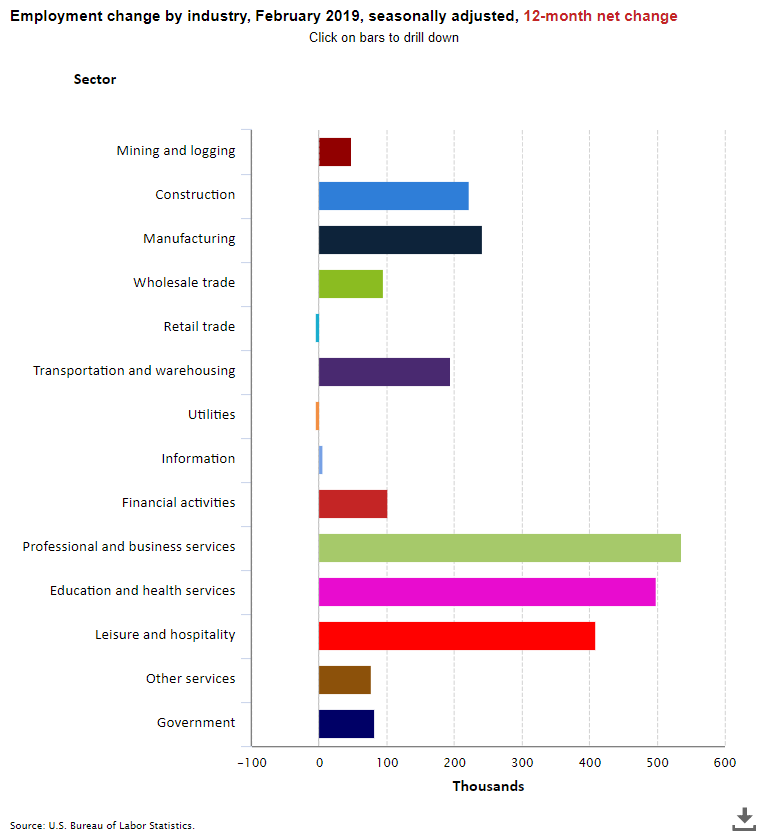
The Labor Department reported that there were 313,000 jobs created in the U.S. economy in February.   This was above the consensus expectation of 205,000 jobs.  This marked the 89th consecutive month of positive job gains for the U.S. economy.  Revisions added 54,000 jobs to the prior two months.

The labor force participation rate, which is a measure of the share of working age people who are employed or looking for work rose by 0.3 percentage point to 63% as strong job opportunities seemed to draw unengaged workers back into the labor force. Nevertheless, this remains quite low by historic standards, at least partially reflecting the effects of retiring baby boomers.

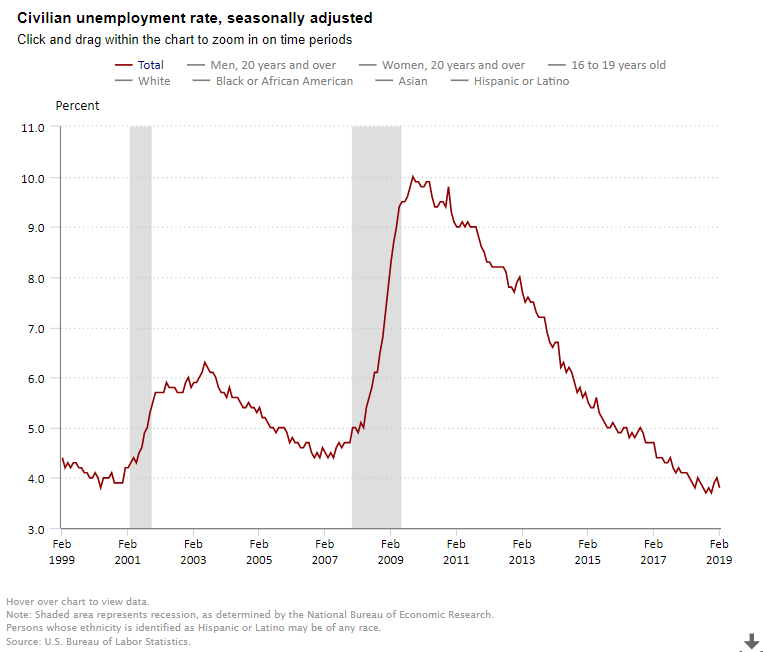
The unemployment rate remained unchanged for the fifth consecutive month at a 17-year low of 4.1% in February. This is below the rate of what the Federal Reserve believes is the “natural rate of unemployment” and suggests that there will be upward pressure on wage rates.   The number of long-term unemployed (those jobless for 27 weeks or more) was little changed at 1.4 million and accounted for 20.7% of the unemployed.  A broader measure of unemployment, which includes those who are working part time but would prefer full-time jobs and those that they have given up searching—the U-6 unemployment rate—was unchanged at 8.2% but was down from 9.2% as recently as December 2016.

Average hourly earnings for all employees on private nonfarm payrolls rose in February by four cents to $26.75. Over the past 12 months, average hourly earnings have increased by 68 cents, or 2.6%. This was less than the 2.9% increase seen in January, when markets became spooked about accelerating wage pressures.

Health care added 19,000 jobs in February. In the past twelve months, health care has added 290,000 jobs.

The February jobs report will provide further support for increases in interest rates through 2018 by the Federal Reserve, with the first 25 basis point increase likely happening at the March 20/21st FOMC meeting.  The Fed has raised rates by a quarter percentage point five times since late 2015, and most recently to a range between 1.25% and 1.50% in December 2017, after keeping them near zero for seven years.  If the Fed raises rates next week, it will be the first overt action by Jerome Powell, the new Chair of the Federal Reserve.


NIC Skilled Nursing Data: Key Takeaways from the Fourth Quarter 2017 Report

– Urban vs. rural occupancy trends diverge
– Medicaid revenue mix nearly 50%


NIC has just released its fourth quarter 2017 Skilled Nursing Data Report, which now includes urban vs. rural trends, along with revenue mix by payor source. In addition to key monthly data on skilled nursing metrics, it includes time-series data from October 2011 through December 2017.

The current report is based on data collected monthly, but reported quarterly, from approximately 20 operators and 1,500 properties.  The data represents national, aggregate figures.  However, NIC plans to grow the data set, adding more operators and properties to produce state-level reports. NIC welcomes the participation of operators nationwide in this confidential data collection process. Participants will receive a free benchmark report every month for their contribution.

Here are some key takeaways from the report:

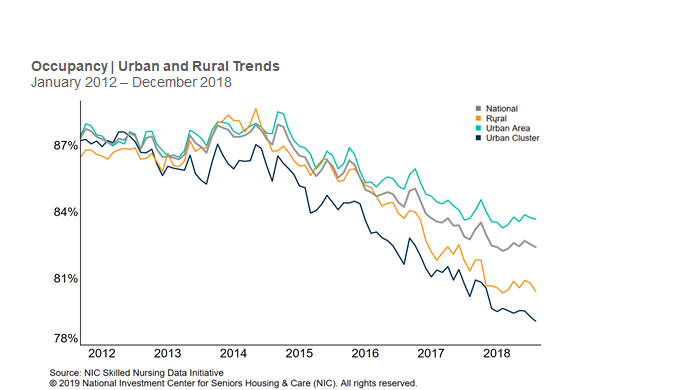
  1. Occupancy continued to decrease in the fourth quarter of 2017 despite an early and severe flu season. Historically, there has been an uptick in occupancy in the fourth quarter if flu season was both early and relatively severe, as it was the case this year. Occupancy decreased 66 basis points from the third quarter of 2017 to end the fourth quarter at 81.9%. Compared to a year ago, occupancy declined 159 basis points from 83.5% in the fourth quarter of 2016.
  2. Differences in occupancy trends in rural and urban settings were pronounced over the last 12 months, with rural occupancy rates declining more sharply than urban. This may reflect many differences including demographics, competition from home healthcare and telehealth, and reforms to the healthcare system. With the introduction of this new geographic perspective on NIC’s skilled nursing data, more research is needed to shed light on the drivers of occupancy in the rural and urban sectors.
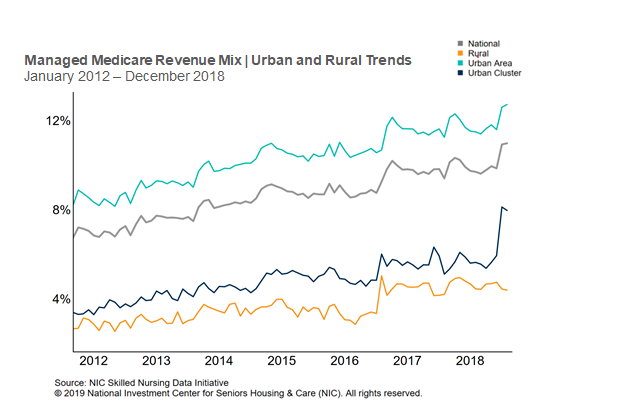
  3. Managed Medicare revenue per patient day (RPPD) pressures were again evident in the latest data as it reached a new low at $433. However, an analysis of urban vs. rural areas suggests that the pressures of managed Medicare are more prevalent in urban areas than rural areas, as the managed Medicare patient day mix currently stands at 7.3% in urban areas and only 2.7% in rural areas. In addition, managed Medicare patient day mix in rural areas has essentially been flat over the past 6.25 years ranging from 2.5% to 2.7%, whereas it grew from 5.8% to 7.3% in urban areas in the same period.
  4. Medicaid revenue mix now represents essentially half of all revenue at skilled nursing properties at 49.3% as of the fourth quarter of 2017. That percentage is up 70 basis points from the prior year in the fourth quarter of 2016. Meanwhile, revenue mix has decreased for Medicare, the highest payor, to 22.8% which is down 98 basis points from the prior year. This trend presents a challenge to the traditional skilled nursing business model as Medicaid, the lowest payor, is growing in revenue mix as the highest payor, Medicare, is decreasing in revenue mix.
  5. Private patient day mix is significantly higher in rural areas when compared to urban areas. Rural private patient day mix is now 15.6% as of the fourth quarter of 2017 compared to only 6.5% in urban areas. One possible explanation for the differences among geography types is that urban skilled nursing properties may face higher competition for market share, in part because of a greater supply of similar products such as home care and other seniors housing types.
  6. A comparatively higher private patient day mix over the years and a significantly higher increase in private revenue per patient day, along with less exposure to the pressures of managed Medicare, are the main drivers of rural areas showing a slight increase in the overall weighted average revenue per patient day across payor types over the past 6.25 years. However, higher expense growth, especially wage rate growth over the years, needs to be factored in when assessing the overall profit of the business.

NIC released its latest Skilled Nursing Data Report on March 7, 2018.  You can download the latest report and future reports here.

Initial Move-in Rates for Independent Living Fall Below Year-Earlier Levels in Q4 2017

 The NIC Map Data Service recently released national benchmark data through year-end 2017 for actual rates and leasing velocity.  Key takeaways include:

  • Average initial move-in rates were below average asking rates for both independent living and assisted living properties, with monthly spreads larger for assisted living properties throughout the entire reported period.
  • As of December 2017, assisted living initial rates averaged 8.3% below the average asking rate, which equates on an annualized basis to an average initial rate discount equivalent to 1.0 months, down from 1.2 months in December 2016. The discount for independent living was smaller at the equivalent of 0.9 month rent but was up from 0.4 months in December 2016.
  • Average in-place rate growth for assisted living has been decelerating in recent months, with the average in-place rate in December 2017 registering only 0.9% higher than year-earlier average rate. In 2016, this figure was 3.4%. Similarly, in-place rate growth has decelerated for independent living, with year-over-year rate growth of 1.5% in December 2017, down from 4.3% in 2016.
  • In contrast, growth rates for average assisted living initial move-in rates accelerated to 2.8% in December 2017 from the year-earlier level, the strongest annual pace since February 2017 and above the in-place rate growth of 0.9%. In contrast, move-in initial rates for independent living were 6.1% below year-earlier levels.
  • The rate of move-ins exceeded or equaled the pace of move-outs in the last eight months of 2017 for assisted living, while the rate of move-outs exceeded move-ins during the early months of 2017. There was no clear monthly pattern for independent living during 2017. The decline in occupancy rates from December 2016 reflects a rate of move-outs that exceeded the pace of move-ins for both assisted living and independent living properties on an annual basis.

The NIC MAP Seniors Housing Actual Rates Report provides national data from approximately 250,000 units within more than 2,500 properties across the U.S. operated by 25 to 30 seniors housing providers. This monthly time series is comprised on end-of-month data for each respective month.


Institutional Capital Drives Transaction Volume Higher in 2017

Nursing care prices fall

Updated transactions dollar volume for 2017 shows an increase from 2016 as the institutional buyer, comprised of mostly equity funds that manage pension money or other types of institutional money, played a major role in higher volume.

A trend has emerged over the past couple years in which institutional buyers have significantly increased the representation of total buyer volume, while also increasing the dollar volume overall. In 2015 the institutional buyer registered $3.2 billion in closed transactions, representing only 15% of all buyer volume. In 2017, the institutional buyer registered $6.6 billion in closed transactions, a 107% increase from 2015, representing 40% of overall transaction volume.

Some relatively large deals to note from the institutional buyer in 2017 were:

  • Kayne Anderson, the institutional alternative investment manager, bought a $633 million portfolio from Sentio Healthcare Properties which consisted of 32 seniors housing and care properties. This deal included some medical office building (MOB) properties which are not reflected in these volume numbers;
  • Columbia Pacific purchased 54 seniors housing properties from Hawthorn Retirement Group for $1.8 billion which included over 6,100 units;
  • Blackstone closed on 60 Brookdale properties from HCP representing $1.1 billion in volume, with a unit count of over 5,500;
  • Blackstone, in another large deal, closed on the Senior Lifestyle’s portfolio from Welltower for $747 billion including 25 properties and over 3,600 units; and
  • Lastly, in another large deal, the Chinese life insurance company, Taikang Life Insurance, purchased a partial interest in the Northstar portfolio, which according to a press release totaled about $460 million and included over 200 properties.

While institutional buying activity increased, public buyer activity decreased significantly after 2015 as a share of volume. Public buyer representation also decreased in terms of overall dollar volume. The public buyer type represented 53% of the $21.9 billion in total closed transactions in 2015. But as of 2017, the public buyer now only represents 23% of the $16.6 billion in total volume. Public buyer volume in 2015 was $11.6 billion and in 2017 it had decreased 67% to $3.8 billion.

Last to mention, let’s not forget about the private buyer segment which includes private REITs, private owner operators, and private partnerships. It has been a very steady buyer, averaging $6 billion dollars per year from 2015 through 2017. Indeed, private buyers have accounted for very impressive deal flow. The private buyer registered $6.8 billion in volume in 2015 and represented 31% of all volume. In 2017, the private buyer registered $5.6 billion and represented 34% of all volume. Even with the relatively weak fourth quarter volume in 2017, the private buyer accounted for $1.2 billion in closed transactions to close out the year.


Pricing

The storyline for seniors housing and nursing care pricing has started to diverge over the past year.

Seniors housing price per unit was flat in the fourth quarter of 2017, compared to the third quarter at $180,500. However, on a year-over-year comparison, seniors housing price per unit is up 9.3% from $165,100. And from its cyclical low in 2010 of $58,600, it is up over 208%, which translates into a 16.2% compound annual growth rate over the period.

The trend for nursing care price per bed is another story. The price per bed dropped 1% to $83,800 in the fourth quarter from $84,600 in the third quarter. On a year-over-year comparison, nursing care price per bed is down a significant 16.5% from $100,300 in the fourth quarter of 2016. However, from its cyclical low in 2009 of $48,700, pricing is up 72%, which equals a 6.4% compound annual growth rate.

It looks like the nursing care price per bed drop has stabilized somewhat this past quarter, but we will see how it holds up over the next few quarters.

Stay tuned for the next transactions blog after the first quarter 2018 data is released.


How to Boost Market Performance and Penetration Rates

As 2018 continues to unfold, construction pipelines are expected to remain full.  Near-record low occupancy levels in assisted living will remain tested, while occupancy pressures will grow in independent living as well.

In markets today with an unfavorable supply/demand imbalance, growing demand penetration rates could help offset supply pressures.

So, how can operators grow their own and the industry’s collective penetration rates?  Below is a list of some possibilities:

  • Create the new “independent living” design and prototype aimed at the boomerang boomer generation—individuals aged 70-plus who want to re-invent themselves with active living, continuing education, second “careers” and volunteerism
  • Provide greater service offerings that help adult children manage the day-to-day needs of their aging parent residents with concierge-type services
  • Engage in an industry-wide “Got Milk?” campaign to demonstrate the benefits and advantages—the value proposition—of residing in a seniors housing property
  • Find solutions to relatively high-cost housing and fee structures to make senior living options more available to lower income-threshold households
  • Reduce the use of high-cost acute services by becoming part of the broader health care continuum and population health management practices that embrace the whole person in a value-based medical system versus a fee-for-service system, and by creating design-efficient, attractive housing with enhanced service and care features
  • Create up-stream and down-stream relationships with hospitals and skilled nursing properties to create comprehensive and coordinated care
  • Provide on-site services such as occupational and physical therapies and regular exercise and wellness programs to prolong residents’ length of stay and improve quality of life
  • Focus on specialty care segments for residents with conditions such as COPD, diabetes, memory care and other care-intensive needs
  • Offer services to the broader local community to familiarize it with seniors housing, while also offering fee-for-service care to the broader community
  • Leverage search engine technology for best-in-class marketing and leasing opportunities
  • Employ technology to improve work efficiencies to afford staff more time with residents and to improve the quality and quantity of care
  • Improve employee retention by providing a culture and work environment that makes staff want to stay in place to enhance long-lasting relationships with residents
  • Provide a stimulating and enhanced environment with opportunity for community-based involvement including intergenerational programs with young adults and children
  • Offer choice of services, programs, dining experiences, room configurations, social outings and events
  • Create outstanding offerings in customer service and customized experiences

Finally, think outside the box and reinvent seniors housing as we know it today.  The “Silent Generation” currently residing in seniors housing was born between 1928 and 1945. What we offer them now is setting the stage for the upcoming wave of baby boomers who will begin to enter seniors housing starting in 2026 when the first of them born in 1946 turns 80.  This boomer generation has proven over the decades that it doesn’t do things the same way as their parents.  And for this, we all need to be approaching the market in new and different ways.