Turning insights into action was more than a theme at the 2024 NIC Spring Conference, it was a goal. The Innovation Labs held in Dallas offered attendees an opportunity to do just that – with some of the brightest minds in the industry.
Returning after their well-received launch at the 2023 NIC Spring Conference, the Innovation Lab sessions brought together industry leaders in smaller, “roll-up-your-sleeves,” workshops that allowed for a more in-depth and dynamic experience to tackle some of the most challenging issues facing the industry.
The conference featured six Innovation Lab workshops on timely topics that included operating models for baby boomers, middle market strategies, the future of Medicare and Medicaid, using data to support senior living’s value, AgeTech, and accessing public funds to enhance profitability. The interactive format provided attendees the chance to collaborate with peers in a small group workshop format. Read further for highlights from two of the Innovation Lab sessions.
Operating Models for Boomers
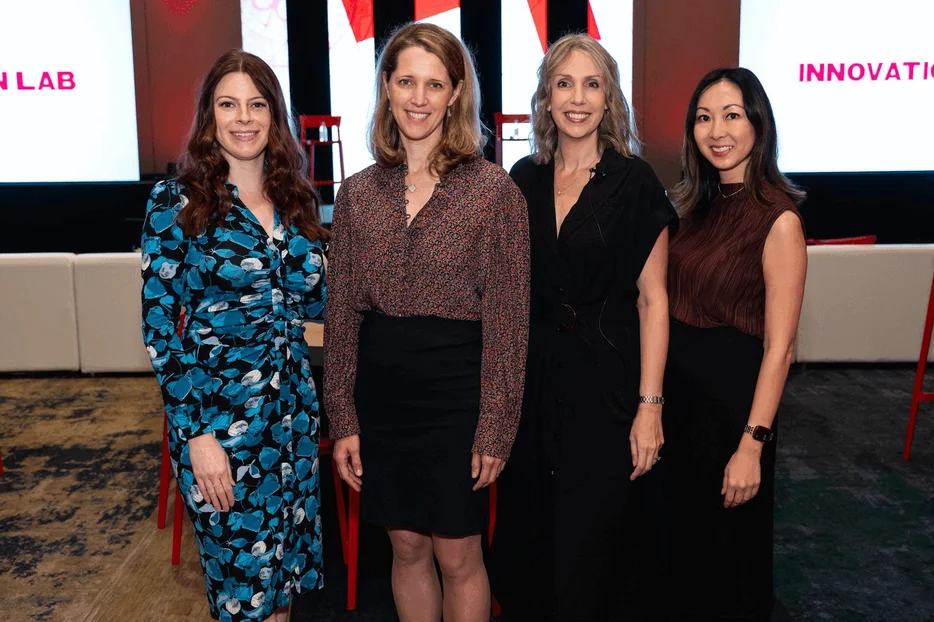
“There are 30 million more boomers than there were silent generation. I’m not sure that has fully sunk in for any of us,” said Bre Grubbs, Partner & Chief Strategy Officer, Leisure Care, opening the first Innovation Lab of the day by laying out just how large the demand will be as boomers enter the senior living market. She emphasized the diversity of the boomer generation while highlighting the vastly different outlooks between the oldest and youngest of the boomers.
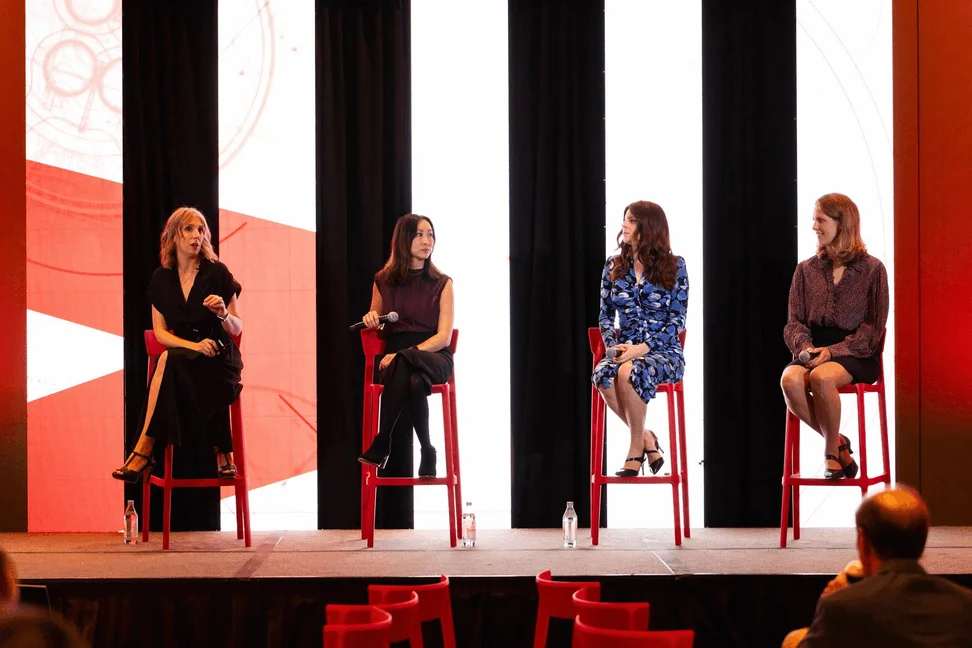
Joining Grubbs in leading the session were Madisen Medley, VP of Business Development at Merril Gardens; Bethany Ghassemi, Chief Legal Officer, HumanGood; and Sophia Lukas, Chief Operating Officer of St. Paul’s Senior Services.
Reviewing results of a survey conducted to understand what boomers want as they age, Grubbs noted that onsite healthcare services weren’t chosen as a want by the boomers in the survey, even though they’ll need them. “What they do want is to stay at home, but the reality is their health may change and then they have no idea what they’ll do.”
As breakout group discussions began, attendees were tasked with addressing different focus areas for working with boomers’ wants and needs including accommodations, healthcare, engagement, and fear.
Ghassemi discussed boomers’ biggest fears, which are overwhelmingly financial—reduction of social security, outliving their savings, declining health leading to long term care expenses – and challenged attendees to think of ways to address them for potential residents.
To stimulate a discussion focused on engagement, a question was asked, “How do we allow people to continue to live their lives the way they want to live them and maintain their lifestyle?” The accommodations workgroup mentioned the varying transportation needs, recognizing that older boomers prefer a campus shuttle while the younger boomers prefer rideshare services like Uber.
Lukas offered a provider’s perspective on healthcare services. She noted that what they have and haven’t had success with both related to access – specialists aren’t coming into the senior living buildings so there’s still a need for transportation, residents prefer to keep their own primary care physician rather than switching to the onsite physician, and even the technology infrastructure required to facilitate telehealth is a consideration.
Discussions turned to meeting the needs of older adults who can’t afford to move into senior housing, including the large middle market contingent, and providing access to services in other ways such as widening the reach to the broader community.
Grubbs concluded the session by committing to summarizing the insights from the discussion groups for NIC volunteer committees to synthesize for future action. She also noted that she would be bringing ideas back to her own organization to explore what they can start implementing.
Middle Market
The number of middle-income seniors will grow to 14.4 million by 2029, double the number just 10 years ago. And there was a full room during the Navigating the Middle Market Innovation Lab, discussing strategies for meeting the looming demand.
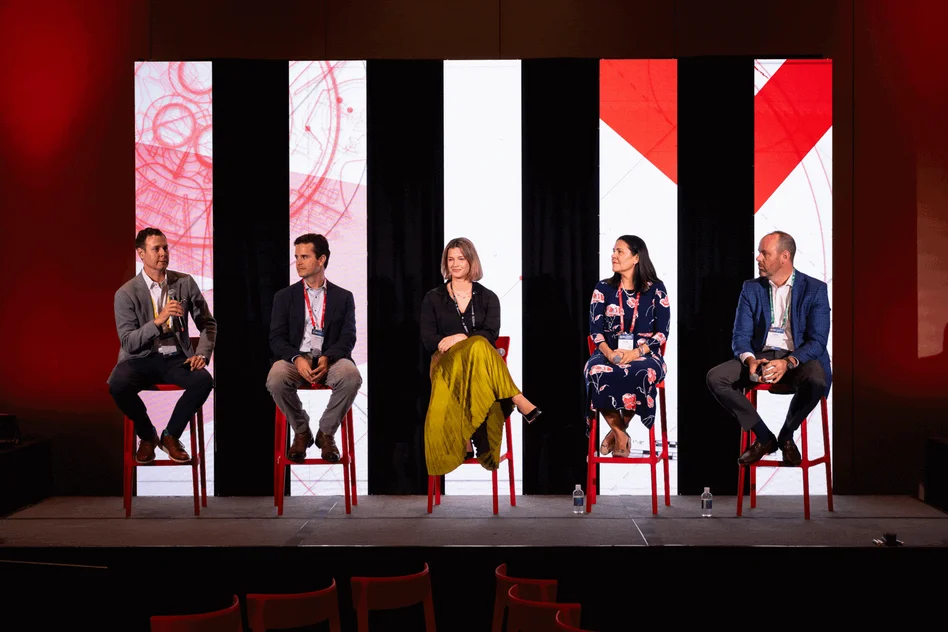
Avery Wallace, Senior Associate at the Milken Institute, opened the discussion with an overview of barriers to serving the middle market, including challenges in managing costs of capital and of care. VIUM Capital’s Executive Managing Director, Steve Kennedy, offered best practices for working with debt providers and noted the importance of communication during each deal phase.
.
“Militant expense controls” were just one of the ’secret six ingredients’ that contribute to Cardinal Senior Management’s success in the middle market said Co-Founder, Joe Pohlen, while Innovation Senior Living’s Founder & CEO, Pilar Carvajal, shared tips from their experience strategically repositioning distressed communities.
Pine Park Health Chief Strategy Officer, Jim Lydiard, chair of NIC’s Partnering for Health Committee, facilitated working group feedback, which included recognition that solutions will need to be market-specific, and suggestions for use of modular and manufactured construction.
Innovation Lab presentation materials are available to conference attendees in the Conference App.