NIC Analytics released the 2Q 2023 NIC Lending Trends Report today. The quarterly report, available complimentary to NIC constituents, includes data trends over seven years for senior housing and nursing care construction loans, mini-perm/bridge loans, and permanent loans from 3Q 2016 through 2Q 2023.
Second Quarter 2023: Market Forces Recap
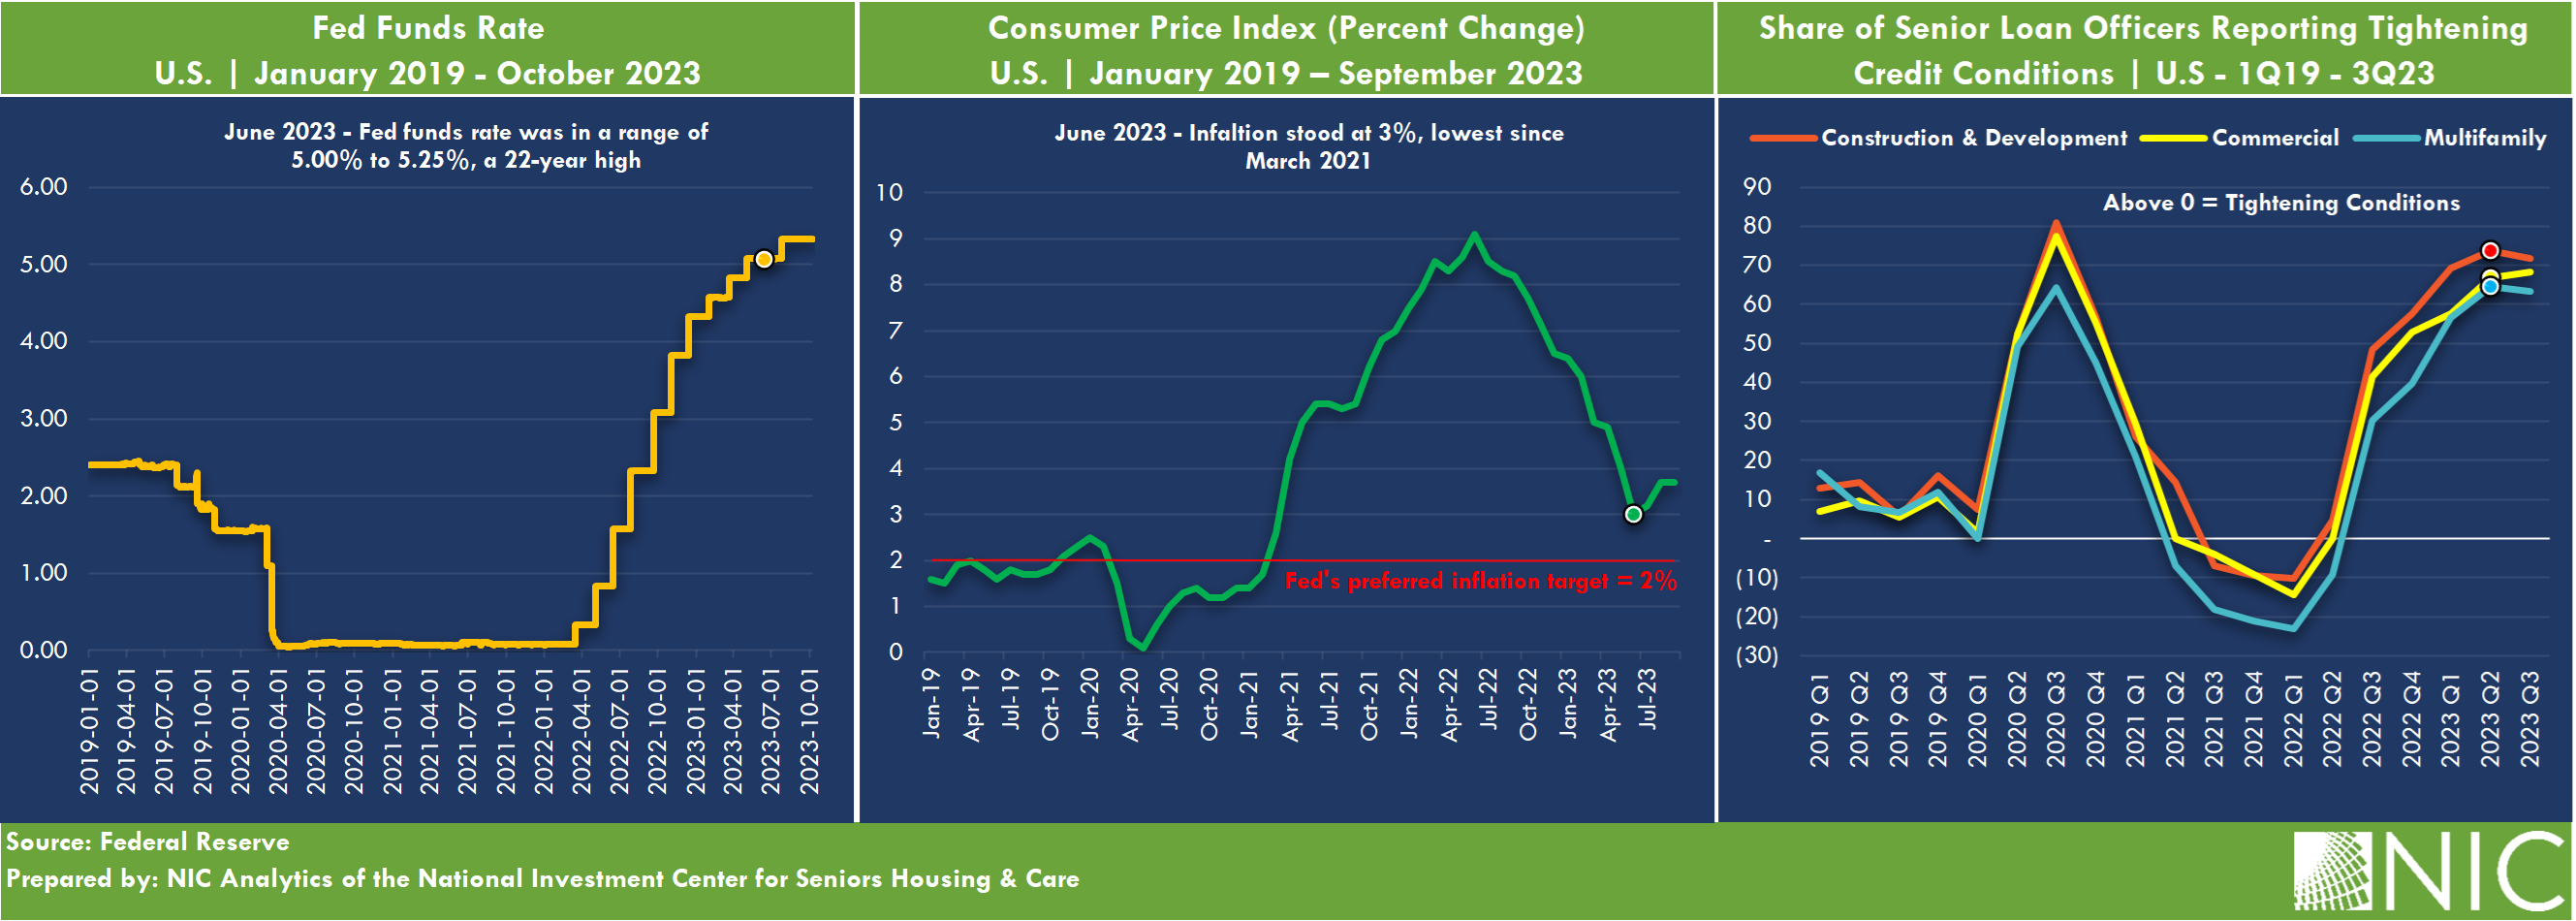
The lending environment continued to tighten through the second quarter of 2023. The Federal Reserve nudged rates higher by another 0.25 percentage points (pps) in May 2023, bringing the federal funds rate to a target range of 5.00% – 5.25%. This was the tenth rate hike since the Federal Reserve’s adoption of a hawkish stance to tame inflation in March 2022. Inflation, as measured by the consumer price index (CPI), has decelerated since June 2022. By June 2023, the rate had slowed for a twelfth consecutive month to 3.1%, marking a considerable decrease from the previous year’s high of 9.1% in June 2022.
The higher interest rate environment since March 2022 has limited the availability of debt and driven borrowing costs significantly higher. Federal Reserve data tracking senior loan officers’ observations of credit conditions across the U.S. showed tighter lending conditions in the second quarter of 2023 in construction, multifamily, and commercial and industrial (C&I) loans. These observations align with the trends identified in the most recent NIC Lending Survey.
Additionally, the disruption to the banking system in the second quarter of 2023 following the failures of Silvergate, Silicon Valley Bank, and Signature Bank, and the sale of First Republic Bank to JP Morgan Chase raised concerns about potential contagion among regional banks.

Takeaways from the 2Q 2023 NIC Lending Trends Report
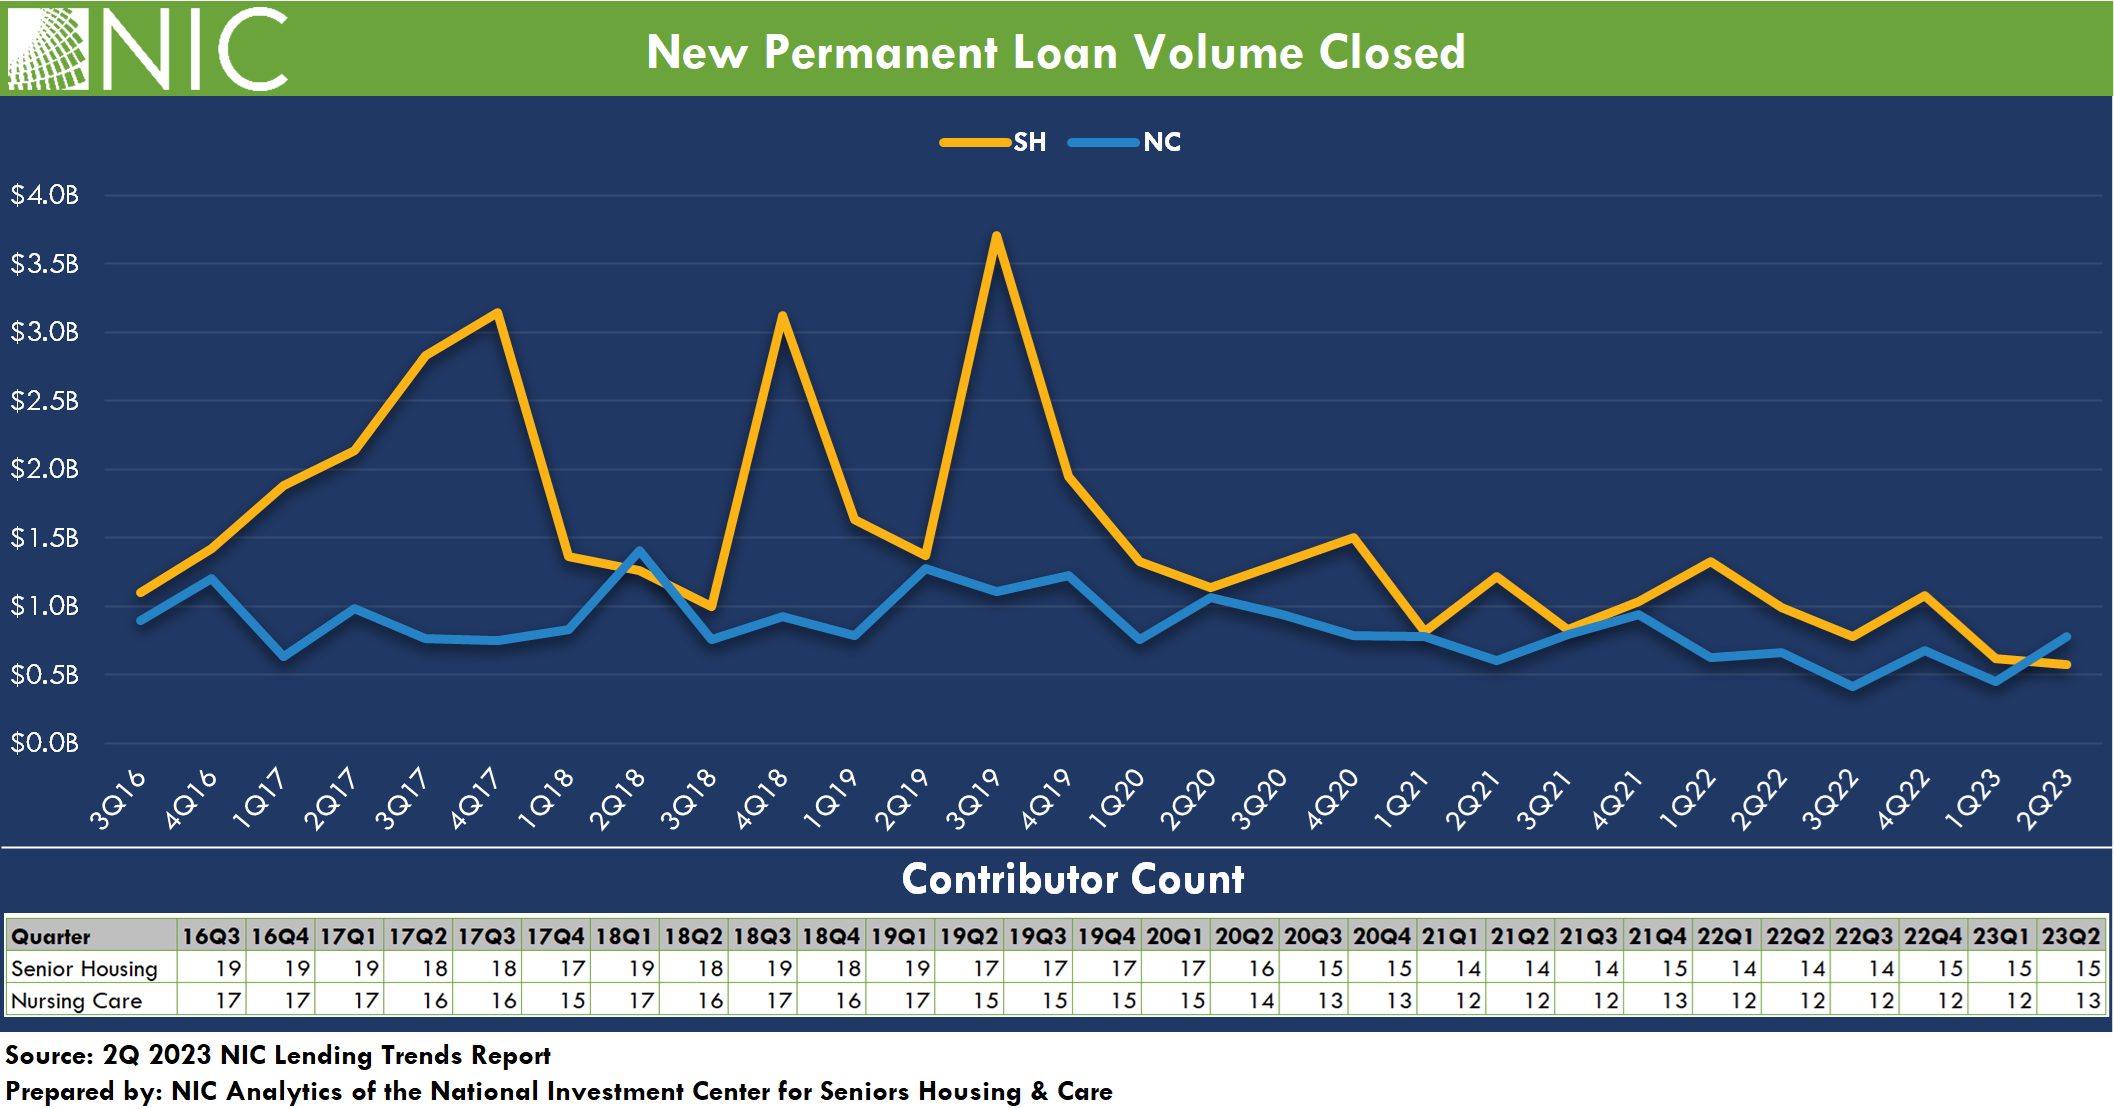
The issuance of new permanent debt for senior housing hit a new low within the time series during the second quarter. Factors adversely limiting the issuance of permanent debt include the disruption in the capital markets, limited debt availability, tightening lending standards, higher interest rates, inflationary pressures, troubles in the banking system, widening spreads (i.e., the amount charged over the risk-free rate to compensate for risk), and reduced loan proceeds. For the sample of lenders in the NIC Lending Trends Report, the volume of new permanent loans closed for nursing care surpassed that for senior housing for the first time since 2018, reflecting a 75% increase versus a decline of 8% for senior housing loan volume from the prior quarter.
The issuance of mini-perm/bridge debt for senior housing dropped further through the second quarter of 2023, and was down by 52% from the prior quarter and 76% from late 2022 levels. Concurrently, nursing care mini-perm/bridge loan closings remained relatively very low and on par with pre-pandemic levels. Borrowers are adjusting to the prevailing “higher for longer” mindset, anticipating sustained rates without a potential decline in the near future. While short-term debt options are limited, those available often come with increased costs and additional credit enhancements e.g., the need for more equity or a repayment guaranty.
New construction loan closings for senior housing remained weak in the second quarter of 2023 compared with historical patterns. Notably, senior housing construction starts remained relatively low in the second quarter of 2023, and the number of senior housing units under construction in the 31 NIC MAP Primary Markets remained near its lowest level since 2015, according to data released by NIC MAP Vision.
As for nursing care, the issuance of construction debt was virtually non-existent for the lenders sampled in the NIC Lending Trends Report. This aligns with the observed pattern of limited debt financing for new nursing care property construction since NIC began data collection in 2016. In fact, there has been limited development of new nursing care properties and overall inventory has been declining for several years.
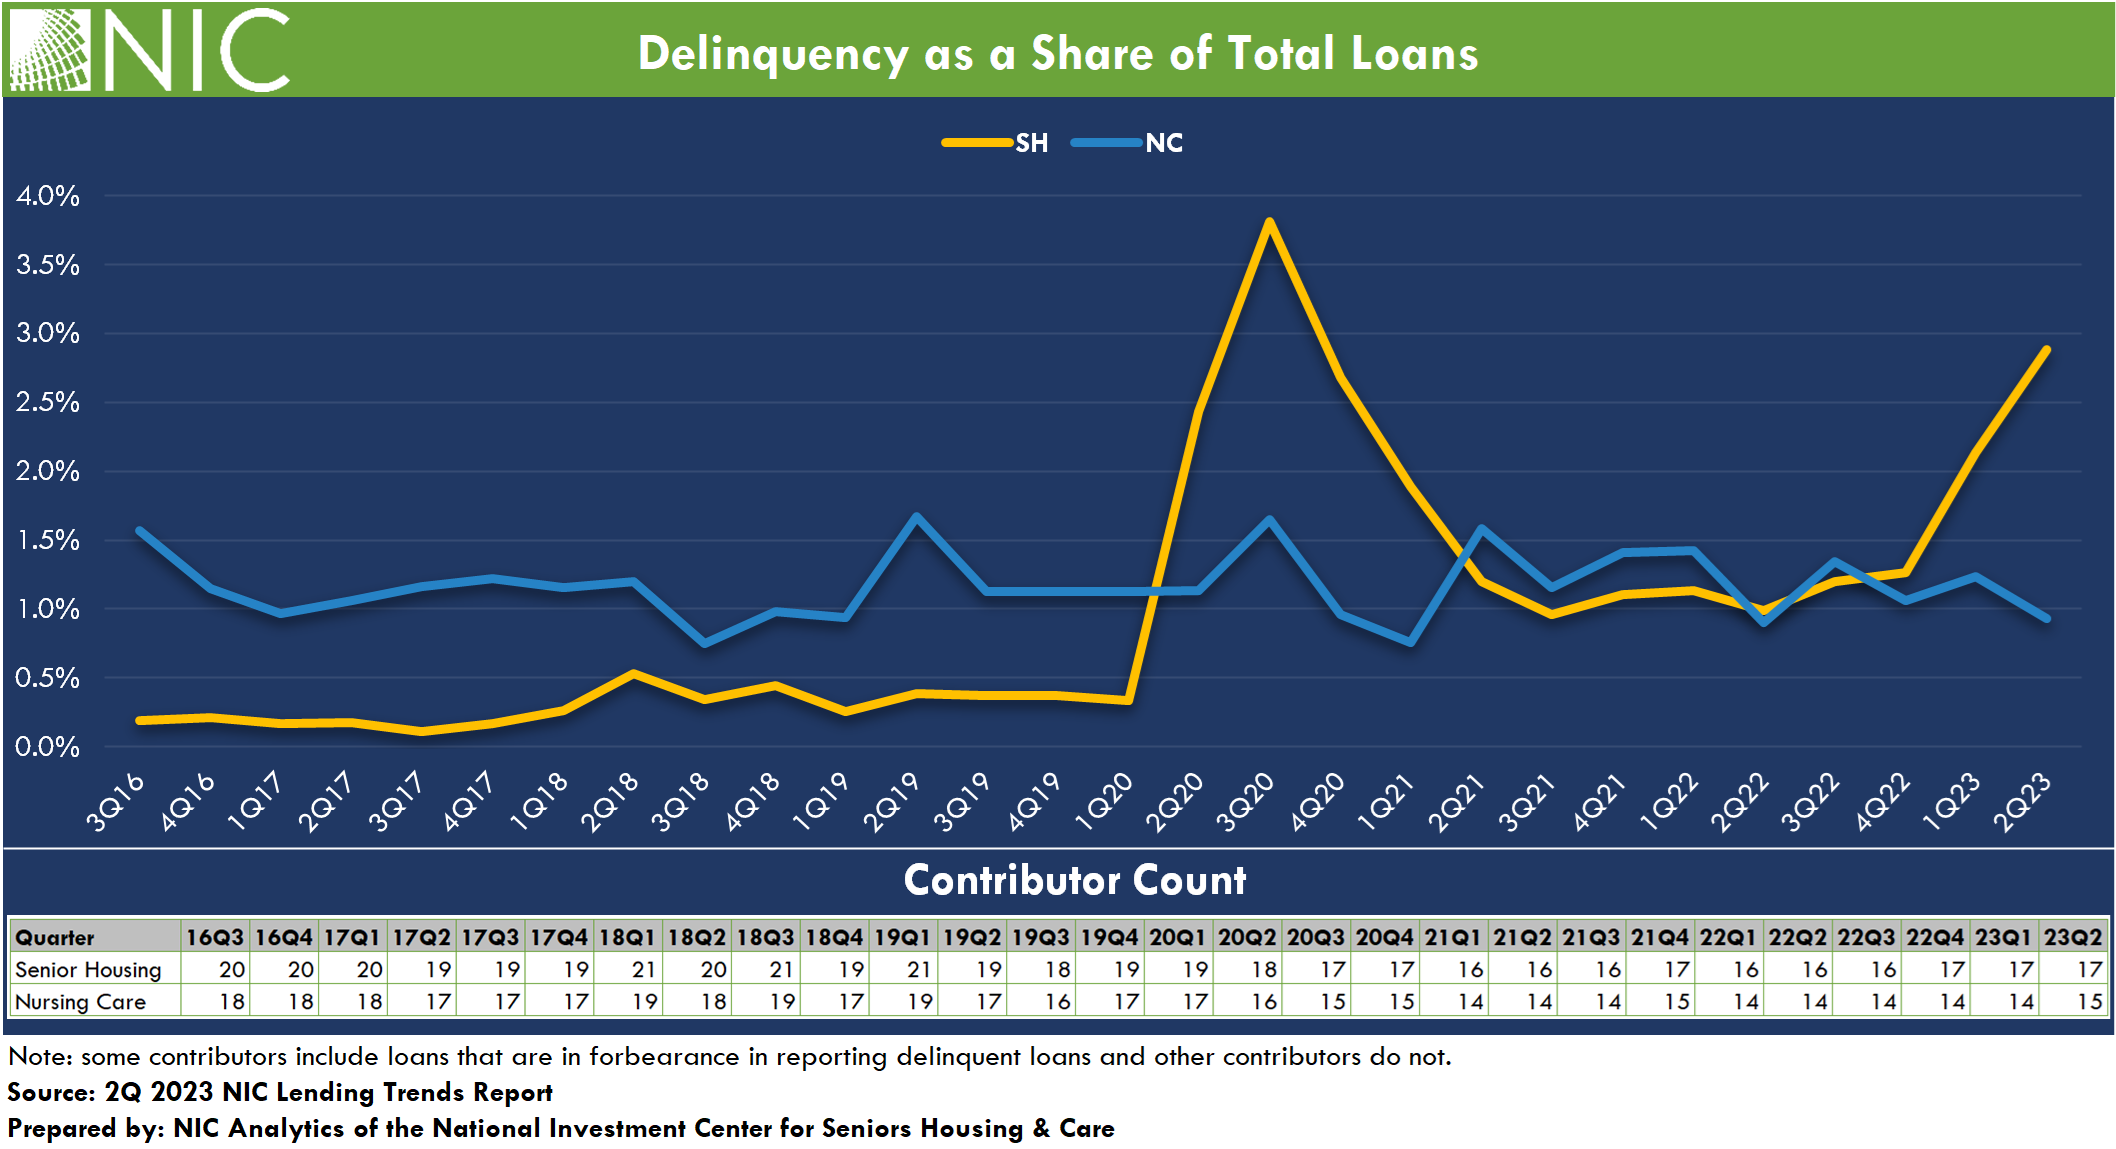
The total balance of delinquent senior housing loans saw a notable increase, although the balance was still lower than the high levels seen in the third quarter of 2020 in the immediate aftermath of the COVID pandemic. Senior housing delinquencies rose by 36% in second quarter 2023, while nursing care delinquencies declined by 24% from the prior quarter. Delinquencies as a share of total loans rose to 2.9% for senior housing, up from 2.1% in the first quarter of 2023. For nursing care, the delinquency rate edged down to 0.9%. Note that loans in forbearance are reported in the delinquent loan data for some debt providers. Also of note, foreclosures were reported for this quarter’s sample of lenders for both senior housing and nursing care, at $14.7M and $71.4M, respectively.
From the Field: 2Q 2023 Survey Comments
For the past two quarters, NIC Analytics has reached out to our network of contributors, asking them questions about the lending environment for senior housing and nursing care. We are asking about their strategies in response to changing capital market conditions, lending patterns with respect to existing versus new clients, and any notable trends they are observing in the market.
In the face of changing capital market conditions, the responses in second quarter 2023 continued to indicate that lenders are reacting to these changing conditions by focusing on strong sponsorship and credits. This trend reflects a reaction to a jump in the SOFR and 10-year Treasury rates, leaner loan proceeds as measured by lower loan-to-value (LTV) ratios, higher equity requirements and tighter spreads. Nevertheless, there was some level of lending activity as shown in the data derived from this survey.
The second quarter of 2023 also saw a focus on long-term relationships with many lenders extending loans predominantly to existing clients. Tightened lending standards and the increase in interest rates and inflationary pressures affected the industry, resulting in fewer new clients being onboarded.
The second quarter of 2023 also witnessed a series of market-shaping events, including Fannie Mae’s revised guidelines focusing on lower leverage loans and higher DSCR requirements, respectively, posing challenges in identifying financing opportunities that fit within debt-service-constrained loans and contributing to a cautious lending environment.
The ongoing rise in interest rates prompted a stronger focus on stabilized senior housing and nursing care properties in proven markets with limited new construction and with proven stability and strong sponsors, as opposed to “riskier” or non-stabilized properties in tertiary markets. Considering these factors, the lending environment is expected to continue tightening throughout the latter half of 2023.
Looking Ahead. As we look beyond the second quarter of 2023, though inflation has decreased significantly from its peak of over 9% last year, the recent months have seen a halt in progress, with inflation still remaining more than a percentage point above the central bank’s 2% targeted rate. The Federal Reserve implemented a 0.25 percentage point increase to 5.25% – 5.50% in July 2023, maintaining stability since then and at its most recent meeting on October 31-November 1. However, the Fed has left open the possibility of another hike, potentially in December 2023.
Download the complimentary 2Q 2023 NIC Lending Trends Report for full details on these and other trends in senior housing and skilled nursing lending.
Note: These data are not to be interpreted as a census of all senior housing and skilled nursing lending activity in the U.S., but rather reflect lending activity from participants included in the survey sample only.
The 3Q2023 NIC Lending Trends Report is scheduled for release in mid-February 2024.
Interested in participating? The NIC Lending Trends Report helps NIC Analytics to deliver on NIC’s mission to enable access and choice by further enhancing transparency of capital market trends in the senior housing and care sectors. We very much appreciate our data contributors. This report would not be possible without them.
If you would like to participate and contribute your data, please contact us at analytics@nic.org. As a courtesy for providing data, data contributors receive this report early before publication on the website. The information provided as part of the survey will be kept strictly confidential. Individual answers will be combined with the answers of all other respondents. Data acquired from this survey will only be reported in the aggregate, and therefore, the resulting aggregated data will not be attributed to you or your company upon distribution.
 Well, what if you didn’t have to choose? For 40 years and counting, senior housing owners and operators have prepared for and responded to the housing needs of aging adults. This market, which includes assisted living and independent living as well as memory care and nursing homes, has seen immense growth. But two problems remain: affordability and integration with comprehensive health services. These issues will persist for future generations if we don’t start solving them today—to allow our grandparents, parents, and eventually ourselves to live in the settings we choose with the appropriate set of health care services we need to age with dignity.
 Bollinger: