Executive Survey Insights Wave 37: January 10 to February 6, 2022

The spread of the COVID-19 omicron variant (and seasonality) had a moderate impact on the pace of move-ins. Move-ins slowed during the Omicron surge.

The spread of the COVID-19 Omicron variant (and seasonality) had a moderate impact on the pace of move-ins. While the pace of move-ins slowed during the Omicron surge, residents were not leaving out the back door of communities at the same rates that they did earlier in the pandemic. Respondents with nursing care beds cited lack of available staff, fewer hospital discharges due to COVID-19, and the holidays as reasons for a deceleration in the pace of move-ins. Notably, between 70% and 80% of organizations reported no change in the pace of move-outs, indicating that most residents have remained in their communities. Of the respondents that noted an increase in the pace of move-outs, three-quarters (75%) indicated that residents were moving to receive higher levels of care. Staffing continues to be operators’ most significant challenge. Roughly four out of five respondents (79%) report that their organizations currently use agency or temp staff to backfill labor shortages. One-half (50%) employ agency or temp staff to supplement nurse aides and about 40% tap agency nurses. Anticipated increases in operating margins in the near term have moderated. Currently, roughly one-half (48%) of organizations expect margins to increase between 1% and 5% in the next six months.

–Lana Peck, Senior Principal, NIC

NIC’s Executive Survey of senior housing and skilled nursing operators is designed to deliver transparency into the market fundamentals as conditions change. Since March 2020, at the beginning of the pandemic, NIC Analytics has received more than 3,200 completed questionnaires with insights on thousands of properties across the nation and by property type. These survey responses have allowed NIC to provide real-time insights into the impact of the pandemic and the pace of recovery. The Executive Survey Insights 2022 questionnaire has been streamlined from prior surveys as we continue to recover from the pandemic. Both standard questions and new, monthly questions track and examine the pulse of the industry—informed by the leadership of seniors housing and care properties.

The “ESI” is the longest-running industry survey offering time-series data on specific market fundamentals and trends influencing our sector. This Wave 37 survey includes responses from January 10 to February 6, 2022, from owners and executives of 78 small, medium, and large seniors housing and skilled nursing operators from across the nation, representing hundreds of buildings and thousands of units across respondents’ portfolios of properties. More detailed reports for each “wave” of the survey and a PDF of the report charts can be found on the NIC COVID-19 Resource Center webpage under Executive Survey Insights.

Across 37 Waves of the ESI, the pace of move-ins has closely corresponded with the broad incidence of COVID-19 infection cases in the United States. This is demonstrated in the timeline below that shows the share of organizations reporting an increase in the pace of move-ins during the prior 30-days. Between survey Waves 32 and 37 (conducted August 9, 2021, to February 6, 2022), the shares of organizations reporting an acceleration in the pace of move-ins trended lower overall, largely due to the spread of the COVID-19 Delta variant and, more recently, the Omicron variant.

Wave 37 Report Charts_Final_Page_2
Move-Ins slowed notably in the higher levels of care in Wave 37. Presumably due to the Omicron variant surge in many parts of the country, fewer organizations with memory care units and/or nursing care beds reported an acceleration in the pace of move-ins since the previous survey (21% vs. 33% for the nursing care segment and 34% vs. 49% for the memory care segment). However, one-half of the organizations with these care segments (and independent living units) reported no change in the pace of move-ins. Respondents with nursing care beds cited lack of available staff, fewer hospital discharges due to COVID-19, and the holidays as reasons for the slowdown in the pace of move-ins.

Wave 37 Report Charts_Final_Page_3
Most reported no change in the pace of move-outs. Between 70% and 80% of organizations reported no change in the pace of move-outs suggesting that although the current pace of move-ins may have been affected by the Omicron variant, most residents have remained in their communities. Of the respondents that cited an acceleration in the pace of move-outs, three-quarters (75%) indicated that residents were moving to receive higher levels of care. And unlike earlier in the pandemic, only one respondent cited resident or family member concerns.

Wave 37 Report Charts_Final_Page_4
Few organizations have regained their pre-pandemic lead volumes. Given pent-up demand coming out of the pandemic and questions about the sustainability of historic and near-historic absorption rates during the third and fourth quarters of 2021 per NIC MAP® data, powered by NIC MAP Vision, this measure in the ESI may be a leading indicator to watch with regards to occupancy recovery. As shown in the chart below, the question of lead volume was benchmarked in Wave 26, with data collected at the beginning of the second quarter of 2021. Contrary to anecdotal reports suggesting a more robust return of leads, only one-third of respondents (32%) indicate that their leads volume is currently at pre-pandemic levels in Wave 37.
Wave 37 Report Charts_Final_Page_5
Staffing remains the operators’ most significant challenge. Since last July, nearly all operators (98% – 100%) responding to NIC’s Executive Survey Insights have reported staff shortages. In the Wave 37 survey, four out of five organizations with multiple sites (81%) reported staff shortages in more than half of their properties—up from roughly one-half (46%) in the Wave 24 survey conducted mid-March 2021. Attracting community/caregiving staff and employee turnover remain significant challenges for survey respondents. When asked about backfilling staffing shortages, 97% – 100% of respondents cited overtime hours since Wave 25 (data collected between March 22, 2021, and January 9, 2022). And more than three-quarters of respondents are currently tapping agency or temp staff (79%).

One-half of organizations use agency or temp staff to supplement nurse aides. Respondents who indicated that their organization currently utilizes agency and temp staff were asked to describe the jobs being filled. One-half of organizations use agency or temp staff to supplement nurse aides, and roughly 40% are backfilling nurses. In the Wave 37 survey, under 10% of respondents sought temp staff to fill food services positions. No respondents sought temp staff in plant operations (such as housekeeping, maintenance, and transportation staff), community administration, or corporate support.

Wave 37 Report Charts_Final_Page_6
Considering CMS data, for the week ending January 23, 2022, approximately 30% of nursing care properties reported shortages of nurse aides, 28% reported nursing staff shortages, and 18% reported shortages of other staff. This data, including vaccination rates among residents and staff of skilled nursing facilities reported to CMS, time-series trends in COVID-19 cases, fatalities, and occupancy with the ability to sort by geographic location, can be viewed by accessing the NIC Skilled Nursing COVID-19 Tracker.

A question was added to the Wave 38 survey (currently in data collection) to understand the degree of operators’ support for a federal investigation of anticompetitive practices by nursing and other direct care staffing agencies. According to the Bureau of Labor Statistics (BLS), nursing and residential care facilities employed three million people in July, down 380,000 workers from February 2020. The American Health Care Association and National Center for Assisted Living (AHCA/NCAL) with the American Hospital Association (AHA), sent a joint letter to the White House’s COVID-19 Response Team Coordinator at the end of January, requesting assistance due to reports of anticompetitive practices by nursing and other direct care staffing agencies.  AHCA/NCAL asked that the White House “urgently devote” the federal government’s attention to these practices. (Both organizations are still waiting on a response from the Federal Trade Commission after writing to the agency to investigate the matter last October.)

Anticipated increases in operating margins in the near term have moderated since last September. Just over one-half of respondents (56%) in Wave 37 anticipate their organization’s operating margins will improve in the next six months. Just under one-half (48%) expect a 1% to 5% increase. While rising wages, insurance premiums, and maintaining infection control measures will continue to be mitigating factors, other factors supporting NOI growth going forward are related to rising occupancy rates and census counts and possibly higher rates, as evidenced by anecdotal comments by some operators that they are implementing rate increases to counterbalance  pandemic and recovery-related cost pressures.

Wave 37 Report Charts_Final_Page_7
Wave 37 Survey Demographics

  • Responses were collected between January 10 and February 6, 2022, from owners and executives of 78 seniors housing and skilled nursing operators from across the nation. Owner/operators with 1 to 10 properties comprise roughly one-half (47%) of the sample. Operators with 11 to 25 and 26 properties or more make up the other half of the sample (31% and 26%, respectively).
  • One-half of respondents are exclusively for-profit providers (50%), more than one-third operate not-for-profit seniors housing and care organizations (37%), and 13% operate both.
  • Many respondents in the sample report operating combinations of property types. Across their entire portfolios of properties, 72% of the organizations operate seniors housing properties (IL, AL, MC), 30% operate nursing care properties, and 36% operate CCRCs (aka Life Plan Communities).

This is your survey! Owners and C-suite executives of seniors housing and care properties, please help us tell an accurate story about our industry’s performance. The ESI 2022 questionnaire has been shortened from prior surveys. While some standard questions will remain for tracking purposes, in each new survey “wave,” a new question or two will be added as per respondents’ suggestions.

Wave 38 of the ESI is now collecting data. The current survey is available and takes five minutes to complete. If you are an owner or C-suite executive of seniors housing and care and have not received an email invitation to take the survey, please get in touch with Lana Peck at lpeck@nic.org to be added to the list of recipients.

NIC wishes to thank survey respondents for their valuable input and continuing support for this effort to provide the broader market with a sense of the evolving landscape as we recover from the pandemic.

New Senior Housing Construction Loans Increase and Other Key Takeaways from 3Q21 NIC Lending Trends Report

The just released 3Q2021 NIC Lending Trends Report shows issuance of new senior housing construction loans jumped in the third quarter of 2021.

The just released 3Q2021 NIC Lending Trends Report shows issuance of new senior housing construction loans jumped in the third quarter of 2021. The increase occurred despite challenges facing new development such as supply chain disruptions, high demand, and rising prices for materials, services, and labor. This indicates that keen interest in new construction and development is returning, reversing the slowdown in lending activity seen earlier in the pandemic.

The quarterly report, available for free to NIC’s constituents courtesy of NIC Analytics, currently tracks over $86.8 billion in senior housing and nursing care loans. The report tracks senior housing construction loans, mini-perm/bridge loans, and permanent loans over five years, from mid-2016 through third quarter 2021.

Key Takeaways

  • The volume of construction loans closed increased for senior housing in the third quarter, showing that interest in construction projects is returning following a pause seen earlier in the pandemic. On a same-store, quarter-over-quarter basis, the increase was 45.0% for senior housing. Construction loans closed for nursing care were also elevated in the third quarter, although new nursing care construction loans closed came in 25.1% lower on a same-store basis from second quarter 2021. It’s noteworthy, however, that construction lending for skilled nursing was about 15% of the level seen for senior housing.

Construction Loans Graph

  • Nursing care also had strong new mini-perm/bridge loans issued in the third quarter, increasing by 27.2% on a same-store, quarter-over-quarter basis from second quarter 2021 and moving back toward its peak of nearly $644 million in fourth quarter 2020. Conversely, the issuance of mini-perm/bridge loans for senior housing continued to edge lower from the peak in fourth quarter 2019.
  • Delinquent loans continued to decline for both senior housing and nursing care in the third quarter from the pandemic-related high point reached in third quarter 2021. Delinquent loans, which include loans in forbearance for some lenders, were 1.0% of total loans in the third quarter for senior housing, the lowest share since first quarter 2020 when delinquencies stood at 0.3%. Nursing care delinquent loans were 1.2% of total loans in the third quarter, down from 1.6% in second quarter 2021. These declines are encouraging signs of continued recovery.

These data are not to be interpreted as a census of all senior housing and skilled nursing lending activity in the U.S., but rather reflect lending activity from participants included in the survey sample only.

The NIC Lending Trends Report for fourth quarter 2021 is scheduled for release in mid-May 2022.

Interested in participating? The NIC Lending Trends Report helps to deliver on NIC’s mission to enable access and choice by further enhancing transparency of capital market trends in the senior housing and care sectors. We very much appreciate our data contributors. This report would not be possible without them.

If you would like to participate and contribute your data, please email us at analytics@nic.org. As a thank you for providing data, data contributors receive this report early before publication on the website. The information provided as part of the survey will be kept strictly confidential. Individual answers will be combined with the answers of all other respondents. Data acquired from this survey will only be reported in the aggregate, and therefore, the resulting aggregated data will not be attributed to you or your company upon distribution.

Employment Up 467,000 Positions in January, Despite Omicron

Labor Department reported that nonfarm payrolls rose by 467,000 in January 2022. This was stronger than expected despite the impact of Omicron.

The Labor Department reported that nonfarm payrolls rose by 467,000 in January 2022. This was stronger than market expectations of an increase of 125,000 and occurred despite the impact of Omicron on the economy. Many analysts had expected the employment numbers to be negatively affected by absenteeism and self-isolation driven by the Omicron virus wave. January’s gain compared relatively favorably to the average monthly gain of 555,000 seen in 2021 and will support the Federal Reserve’s intention of raising interest rates as soon as March. Revisions added 709,000 to total payrolls in the previous two months. Nonfarm payrolls have now increased by 19.1 million since their pandemic trough in April 2020 but are still down by 2.9 million or 1.9% from their pre-pandemic level in February 2020.

Concerns about rising wage costs and inflation are further supported by this report. Average hourly earnings for all employees on private nonfarm payrolls rose by $0.23 in January to $31.63, a gain of 5.7% from a year earlier.

In a separate survey conducted by the BLS, the jobless rate edged up by 0.1 percentage point to 4.0% in January 2022, down 2.4 percentage points from year-earlier levels. The jobless rate is now 0.5 percentage points above the pre-pandemic level of 3.5% seen in February 2020, and well below the 14.7% peak seen in April 2020.

2022-02-04 07_40_44-Civilian unemployment rate

The underemployment rate or the U-6 jobless rate was 7.1%, down from 7.3% in December 2021. This figure includes those who have quit looking for a job because they are discouraged about their prospects and people working part-time but desiring a full work week.

After adjusting for annual revisions and adjustments to population estimates, the labor force participation rate was unchanged at 62.2% in January but remains below the February 2020 level of 63.4%. The employment to population ratio was little changed at 59.7%, also below the February 2020 level of 61.2%.

2022-02-04 07_41_56-Employment by industry, monthly changes

Overall employment in health care was up by 18,000 positions in January but is down by 359,000 or 2.3% from its February 2020 level. And within health care, nursing and residential care facilities was largely unchanged from December at 2.98 million positions but was down 120,000 from year-earlier levels. 

Skilled Nursing Occupancy Flat in November 2021

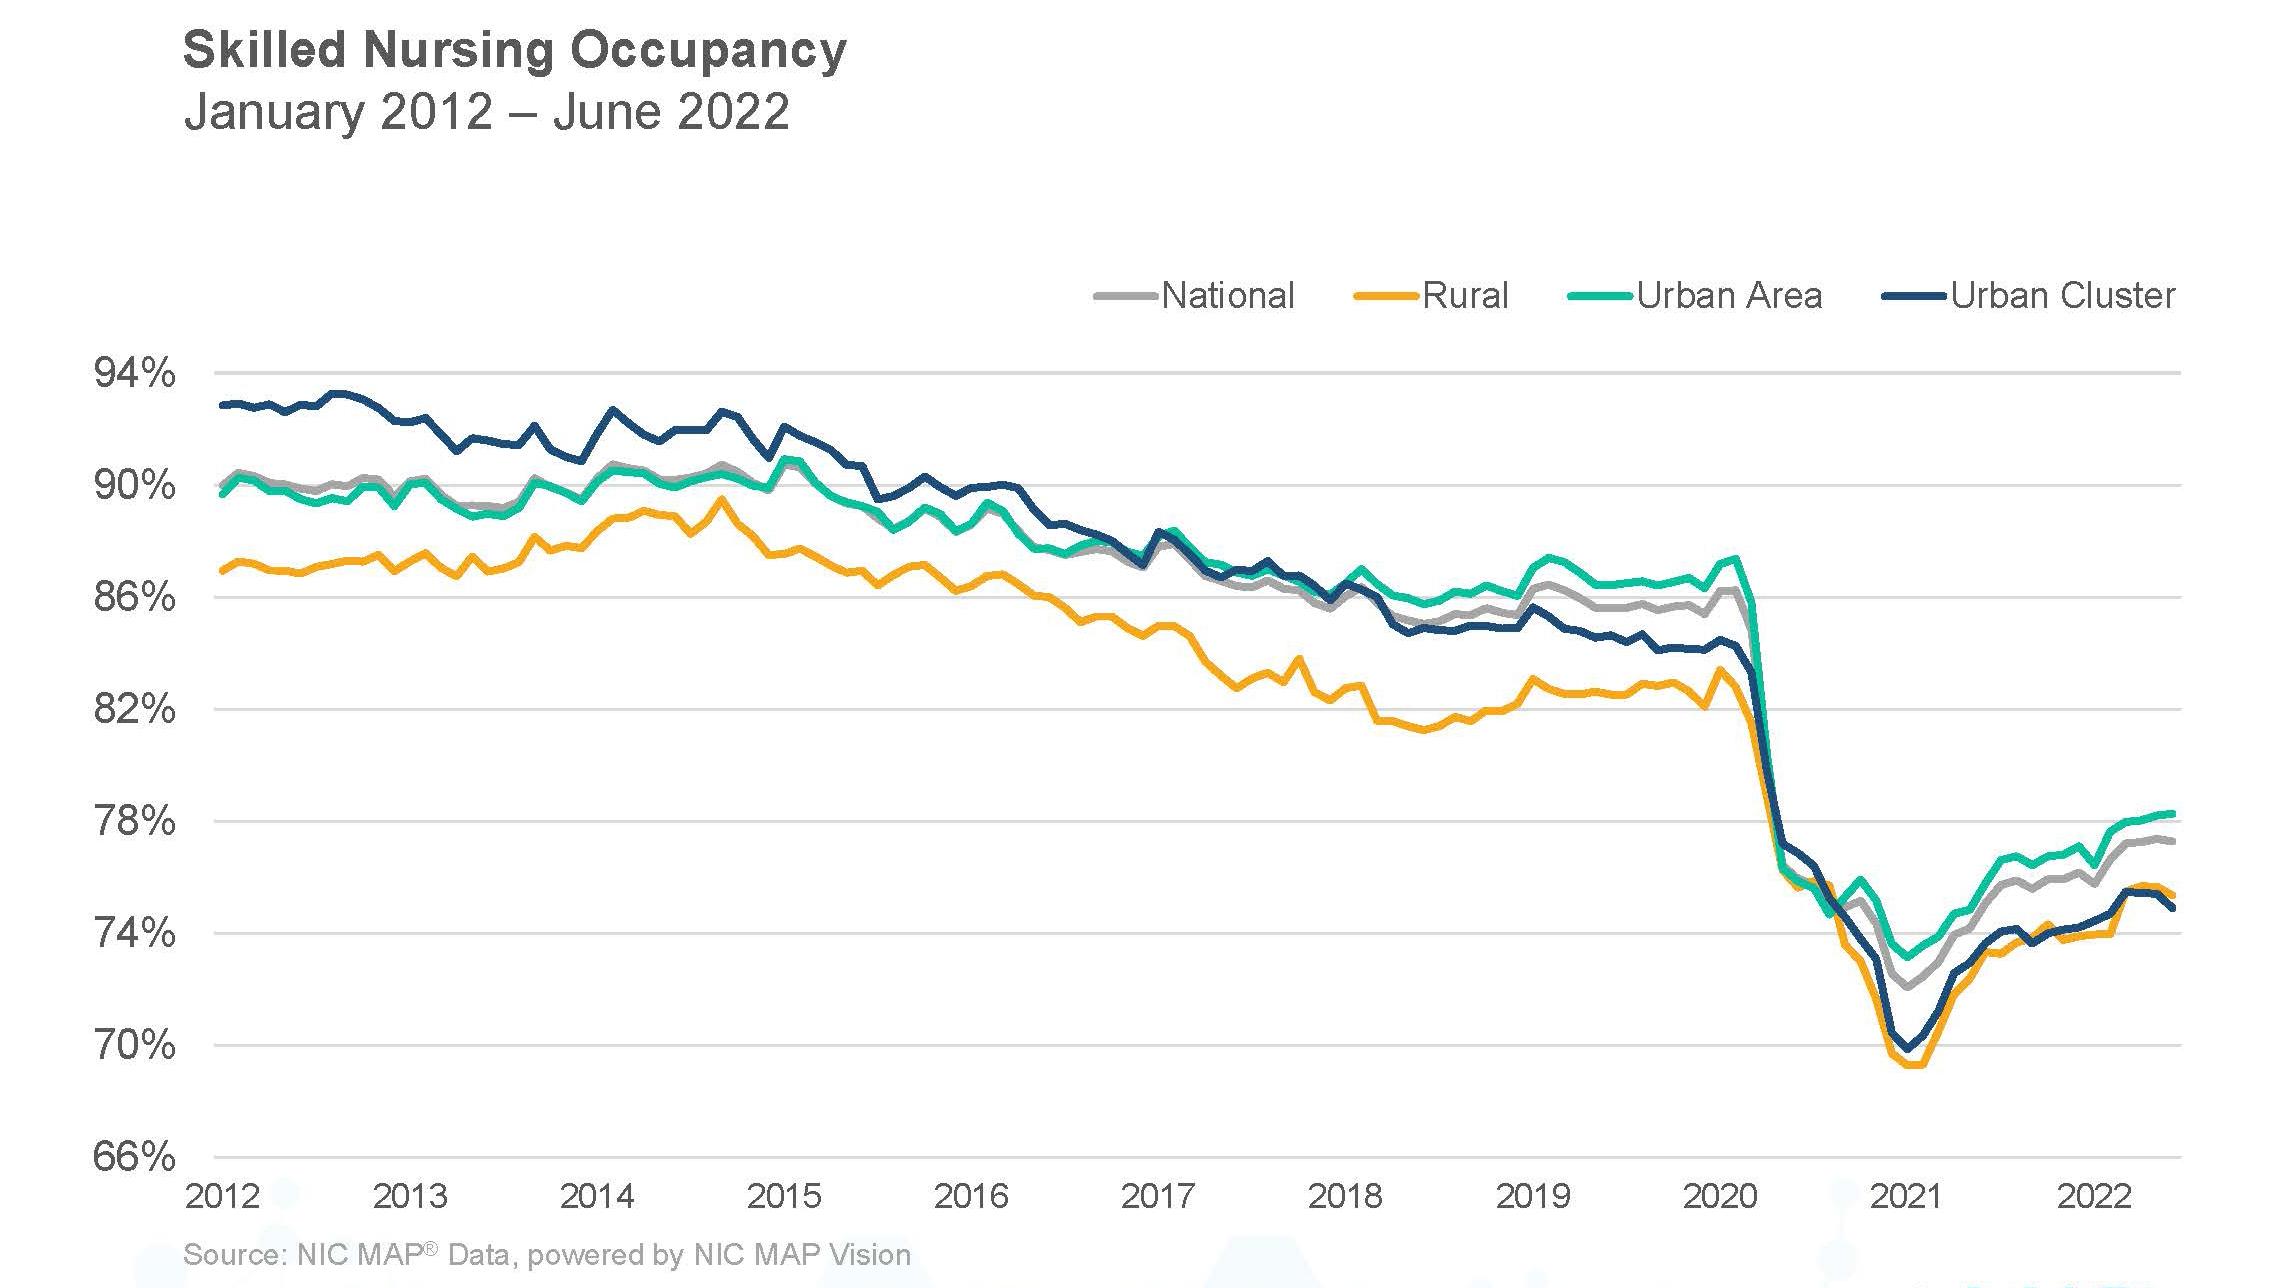
Skilled nursing property occupancy was flat in November, ending the month at 75.7% after increasing 28 basis points from September to October.

“Skilled Nursing occupancy has leveled off in the 75% range since July, according to the latest data through November 2021. This suggests the Delta variant had an impact as the labor crisis intensified, which limited the ability to accept new patient admissions.”

– Bill Kauffman

NIC MAP® data, powered by NIC MAP Vision, released its latest Skilled Nursing Monthly Report on February 3, 2022. The report includes key monthly data points from January 2012 through November 2021.

Here are some key takeaways from the report:

Skilled nursing property occupancy was flat in the month of November, ending the month at 75.7% after increasing 28 basis points from September to October. Occupancy has been relatively flat since July, and is now 381 basis points above the low point reached in January 2021 (71.9%). It was expected that admissions to skilled nursing properties would increase at a faster pace in 2021, but the COVID-19 Delta variant over the summer months posed a challenge to operators as did staffing shortages across the industry. Most recently, staffing shortages have caused many operators to limit patient admissions because they are unable to hire additional caregivers. The Omicron variant is expected to cause additional pressure on occupancy in the winter months. Occupancy remains very low compared to February 2020 pre-pandemic levels of 86.0%.

2022_NNB_Feb03_SNF_Slide 15_croppped

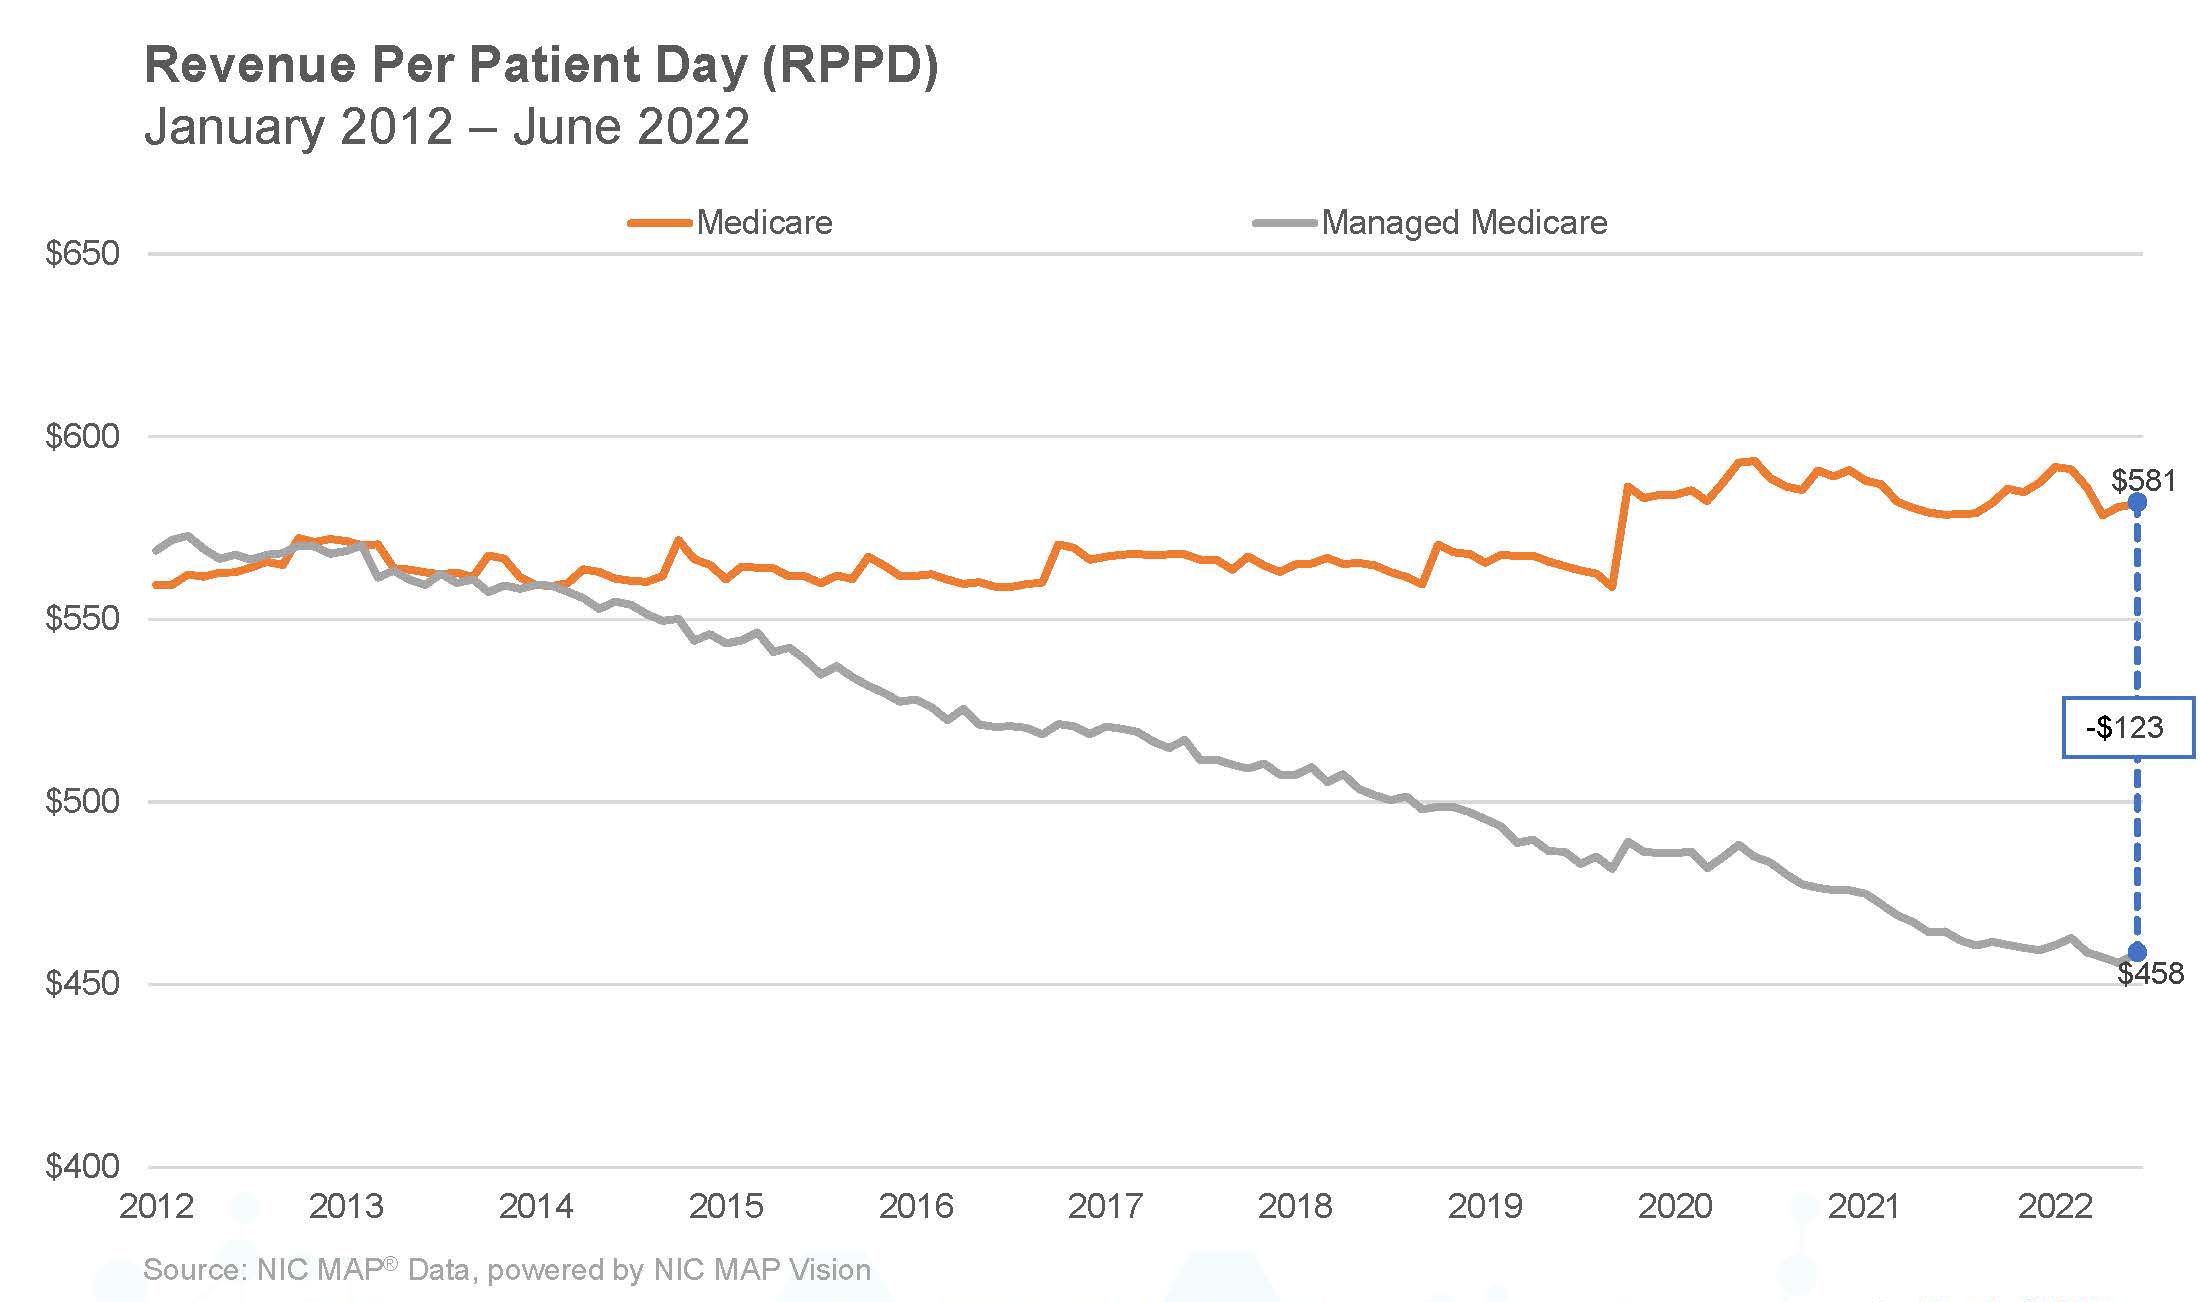
Medicare revenue mix ended November at 20.3%, which was a 23 basis point increase from October. However, it is down from its pandemic high of 24.6% set in January 2021. The revenue mix has increased 65 basis points since September, which in part is likely a result of the increase in Medicare rates to skilled nursing properties for fiscal year 2022. That increase was implemented in October. However, since January of 2021, the longer-term downward trend in Medicare revenue mix continued as fewer COVID-19 cases in properties have resulted in less need for utilizing the 3-Day rule waiver and per day reimbursement for COVID-19 positive patients.

2022_NNB_Feb03_SNF_Slide 13_cropped

Managed Medicare patient day mix decreased slightly (8 basis points) from October to 7.2% in November and has oscillated in that range since June 2021. However, it is down 48 basis points from its high set in February (7.7%), which suggests lower patient admissions from managed Medicare given the increase in overall occupancy within the same timeframe. On the other hand, it has increased 214 basis points from the pandemic low of 5.1% set in May 2020 when states around the country implemented a suspension of elective surgeries, which had a direct impact on lower hospital referrals to skilled nursing properties.

Medicaid patient day mix decreased for the second month in a row, falling 51 basis points from October to end November at 66.2%. This decline, coupled with the fact that occupancy held steady in November, suggests that Medicare patient days were responsible for preventing a month-to-month decline in occupancy. However, Medicaid patient day mix has increased 245 basis points from the pandemic low of 63.7% set in January 2021. In addition, Medicaid revenue mix decreased, dropping to 50.3% from 51.6% in October.

To get more trends from the latest data, download the Skilled Nursing Monthly Report. There is no charge for this report.

The report provides aggregate data at the national level from a sampling of skilled nursing operators with multiple properties in the United States. NIC continues to grow its database of participating operators to provide data at localized levels in the future. Operators who are interested in participating can complete a participation form. NIC maintains strict confidentiality of all data it receives.

Interested in learning more about NIC MAP data? To learn more about NIC MAP data, powered by NIC MAP Vision, and about accessing the data featured in this article, schedule a meeting with a product expert today.

Near-Record High Demand for Senior Housing and Other Key Takeaways from NIC MAP Fourth Quarter 2021 Senior Housing Data Release Webinar

NIC MAP Vision clients, with access to NIC MAP® data, attended a webinar in January on key seniors housing data trends during the fourth quarter of 2021.

NIC MAP Vision clients, with access to NIC MAP® data, attended a webinar in mid-January on key seniors housing data trends during the fourth quarter of 2021.Findings were presented by the NIC Analytics research team. Key takeaways included the following: 

Takeaway #1: Senior Housing Occupancy Up 2.3 Percentage Points from Pandemic Low  

  • Occupancy jumped one full percentage point to 81.0% in the fourth quarter due to favorable supply and demand conditions. From its low point of 78.7% in the first and second quarters of 2021, it is up 2.3 percentage points.  However, it remains 6.4 percentage points below its pre-pandemic level of 87.4%. 
  • For seniors housing, inventory growth continued to slow to only 2,910 units in the fourth quarter.  This was the fewest units added to inventory since the first quarter of 2019.  For further perspective, its pre-pandemic 10-year quarterly average was 3,333 units per quarter.  
  • Inventory growth has generally trended down from its high point of 6,100 units in mid-2019. It’s likely to continue to do so due in the near term to a slowdown in starts in 2020 and early 2021.  

Takeaway #2: Record High Demand Occurred in Second Half of 2021 

  • The second half of 2021 will be remembered as a time of rebounding demand as it registered the strongest unit improvement of net positive absorption, as measured by the change in occupied stock, since NIC MAP began reporting the data in 2005. 
  • More specifically, demand continued to strengthen in the fourth quarter, albeit at a slower pace than in the record-setting third quarter.  Indeed, net absorption continued to recover in the fourth quarter of 2021, increasing by 9,035 units in the Primary Markets, the 2nd strongest unit increase since NIC MAP Vision began reporting the data in 2005. In the third quarter, net absorption totaled 11,994 units.  For both quarters, this equaled 21,029 units.  Combined with the second quarter (3,401 units), net absorption increased by 24,430 units in the last nine months of 2021
  • Notably, this is a clear reversal in trend from the loss of 42,129 units during the pandemic in the second, third and fourth quarters of 2020 and the first quarter of 2021.

Takeaway #3: Very Large Chains Saw Most Increase in Occupancy Rates in Fourth Quarter 

  • Very large chains (operators with 25 properties or more), have consistently had lower occupancy rates than other chain groupings. Very large chains also incurred the largest occupancy drop related to the pandemic—down 10.1 percentage points. But they have also seen the largest improvement in occupancy since hitting bottom in the first quarter.  In the fourth quarter, the occupancy rate for very large chains was 78.4%, a 3.3 percentage point improvement from its nadir of 75.1% in the first quarter of 2021. 
  • Large chains (10 – 24 properties) had the second-best improvement in occupancy rising from 80.3% at its pandemic-related low in the first quarter to 83.2% at year end, a gain of 2.9 percentage points.  Moreover, large chains had the highest fourth quarter occupancy of any of the groupings.
  • Single properties were not far behind, however, at 83.0%. 

Takeaway #4: Occupancy Distribution Varies by Market 

  • The average occupancy rate for seniors housing in the 31 Primary Markets was 80.1% in the fourth quarter while the median occupancy was 84.6%.  This large difference means that the range of occupancy rates by individual properties is broad and the distribution wide. 
  • In the fourth quarter, 14.7% of the Primary Markets properties had occupancy rates above 95% and another 18.4% had occupancy rates between 90 and 95%.  But by market this varies considerably.  
  • Conversely, 39.2% of properties in the data base had occupancy rates below 80%. This is better than 41.8% in the third quarter, but well above the 22.3% pre-pandemic.  This cohort includes those properties that opened during a global pandemic and those properties that have slipped in occupancy during this period. This suggests that there are still many operators dealing with properties that have very challenged occupancy rates. 
  • The markets with the lowest overall occupancy rates—Houston, Cleveland, and Atlanta—not surprisingly have more than 45% of their properties with occupancy rates below 80% (Houston has 51.1%) and much smaller shares with occupancies above 90%.  Some of this occupancy performance may be due to a higher share of newly opened properties in some markets more than in others.
  • San Jose, San Francisco, and Boston in contrast easily have more than one-third of their properties with occupancy rates above 90%, with Boston having 43% of its properties.  Atlanta, by contrast, has 22%.   

FINAL 4Q21 Webinar_Slide20_croppedV2 

Key Takeaway #5:  New Construction Loan Volume Picking Up Again 

  • This chart looks at closed construction loan volumes from 2016 through the second quarter of 2021 and is based on NIC’s Lending Trends Report. The full report can be found on our website. 
  • The chart mimics the pickup in starts activity that began last year since capital is a requirement and prerequisite for breaking ground on new projects.  
  • Indeed, on a four-quarter moving sum basis, starts have turned the corner and are picking up once again after having been on the decline in the immediate aftermath of the pandemic in 2020.    
  • For independent living, starts totaled 8,204 units, on a four-quarter sum basis, the most since mid- 2020.  For assisted living, there were 9,648 units started on a four-quarter aggregate basis in the fourth quarter, equating to 2.9% as a share of inventory. For perspective, at its peak in early 2016, it was 6.0%. 
  • Third quarter data on lending trends will be out in mid-February. 

FINAL 4Q21 Webinar_Slide22_cropped

Interested in learning more? 

  • While the full key takeaways presentation is only available to NIC MAP clients with access to NIC MAP data, you can access the abridged version of the 4Q21 Data Release Webinar & Discussion featuring my exclusive commentary below. 
  • View the Abridged Slides Presentation
  • To learn more about NIC MAP data, powered by NIC MAP Vision, an affiliate of NIC, and accessing the data featured in this article, schedule a meeting with a product expert today.