Experienced Operator Kai Hsiao: “Senior Housing Tourists Are Just Visiting”

“If there was ever a debate about whether we are hospitality or healthcare, COVID has made people realize we are part of the healthcare continuum.”

KaiHsao-HeadshotEver heard of senior housing tourists?

No, they’re not busloads of elderly travelers crisscrossing the country to visit assisted living communities. They’re not mature sightseers either, snapping photos of the latest amenity spaces.

Instead, senior housing tourists are how Kai Hsiao describes newbie investors, developers, and operators in the senior housing industry, many of whom have failed to appreciate the healthcare aspects of the business. “If there was ever a debate about whether we are hospitality or healthcare, COVID has made people realize we are part of the healthcare continuum,” said Hsiao. He explains that some pop-up developers and operators are discovering that the business is no vacation. “Senior housing tourists are just visiting,” he said.

“If there was ever a debate about whether we are hospitality or healthcare, COVID has made people realize we are part of the healthcare continuum.”

As CEO of Eclipse Senior Living, Hsiao has a lot of insights into the future of operations. Portland, Oregon-based Eclipse is a third-party manager with 106 communities in 27 states, offering independent and assisted living, and memory care. The company has three brands that cover the continuum of care at various price ranges: Elmcroft, Embark and Evoke.

Hsiao is among the thought leaders looking forward to attending the 2021 NIC Fall Conference in Houston. The Conference is NIC’s first in-person convening of leaders in seniors housing and care since the pandemic began. Many industry leaders will seize the chance to share ideas with others weathering the same challenges, while simultaneously building the relationships that will help them succeed in the future.

Financial Focus

While 2020 was a year when operators struggled to combat the COVID-19 outbreak, Hsiao thinks 2021 is the year when operators will struggle to combat the financial impacts of the outbreak. Lower occupancies and higher expenses incurred in 2020 are having a big impact today. Also, many of the financial programs set up to help operators during the pandemic like rent and debt deferrals are ending. Finally, another round of government aid hasn’t been allocated yet. Lacking experience, and strong, well-established relationships in the industry, senior housing tourists could have the roughest road ahead.

Workforce pressures are adding to industry woes. The labor pool is thin. Wages are rising. But Hsiao doesn’t believe higher wages alone are the answer. “Think like a staffing agency,” he advised. “If we can’t staff, we can’t provide services.” The idea at Eclipse is to treat the hiring pipeline like a sales pipeline. The company hired more recruiters which means more applications, more interviews and more hires. Some administrative work is centralized. If a property can’t conduct an interview within 48 hours, the central office conducts the interview. “It speeds the flow of the process,” said Hsiao.

Reflecting on the past year, Hsiao thinks the industry will definitely survive the COVID catastrophe. Occupancies are rising. The aging population that will need housing and care is growing

In the near term, Hsiao expects more industry consolidation. “COVID has proven that scale matters. The bigger a company is, the easier it is to procure goods and services, and have the resources necessary to handle challenges like a pandemic” he said. “It will be an interesting year.”

U.S. Jobs Increase by a Strong 850,000 in June

The Labor Department reported that nonfarm payrolls rose by a strong 850,000 in June 2021. The consensus estimates for June had been for a gain of 720,000. Employment is now up by 15.6 million since April 2020 but is down by 6.8 million or 4.4% from its pre-pandemic level in February 2020.

The Labor Department reported that nonfarm payrolls rose by a strong 850,000 in June 2021. The consensus estimates for June had been for a gain of 720,000. Employment is now up by 15.6 million since April 2020 but is down by 6.8 million or 4.4% from its pre-pandemic level in February 2020.

The robust jobs report followed reports earlier this week that show a strengthening economy. This includes reports of strong consumer confidence, improving outlooks for capital spending by businesses and a report from the Congressional Budget Office (CBO) that projected a full recovery of pandemic-related job losses by the middle of 2022.

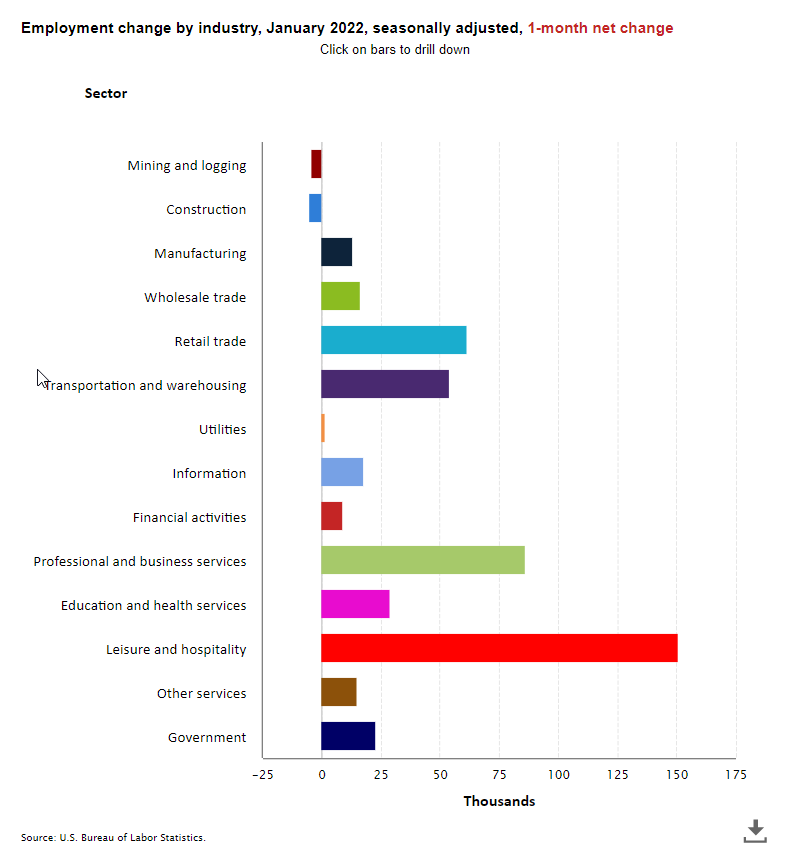
Notable job gains occurred in leisure and hospitality (343,000), in public and private education, professional and business services, retail trade and other services.

Jobs_060421

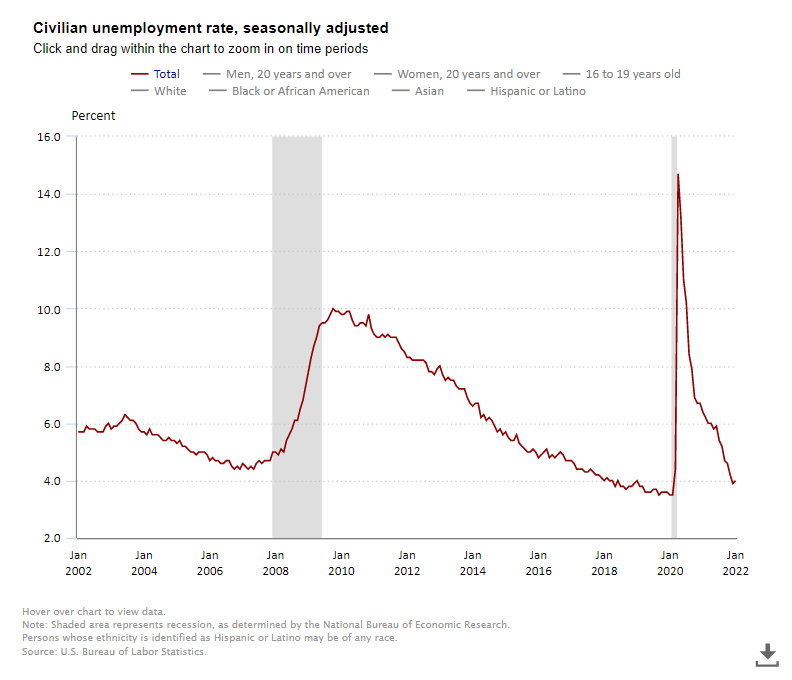
Separately and from a different survey, the Labor Department reported that the unemployment rate inched up to 5.9% in June from 5.8% in May. The jobless rate is now 2.4 percentage points above the pre-pandemic level of 3.5% seen in February 2020, but well below the 14.7% peak seen in April 2020. The underemployment rate or the U-6 jobless rate was 9.8% down from 10.2% in May 2021. This figure includes those who have quit looking for a job because they are discouraged about their prospects and people working part-time but desiring a full work week.

The number of long-term unemployed (those jobless for 27 weeks or more) increased by 233,000 to 4.0 million but is 2.9 million higher than in February 2020, suggesting that this continues to be a very challenging time for many Americans. Long-term unemployed persons account for 42.1% of the total number of unemployed persons.

The labor force participation rate, which is a measure of the share of working age people who are employed or looking for work was steady at 61.6% in June and has remained within a narrow range of 61.4% to 61.7% since June 2020. The participation rate is 1.7 percentage points lower than in February 2020. Many workers have dropped out of the labor force since the pandemic began to take care of family members or out of fear of working and catching the virus.

Average hourly earnings for all employees on private nonfarm payrolls rose by $0.10 in June to $30.40, a gain of 3.6% from a year earlier and followed an increase of $0.21 in April. The data suggests that rising demand for labor associated with the recovery from the pandemic may be putting upward pressure on wages. That said, the Labor Department warns that the pandemic has affected the ability to fully interpret the wage data due to the wide swings in employment trends.

july-chart

The change in total nonfarm payroll employment for April was revised down by 9,000 from a gain of 278,000 to 269,000 and the change for May was revised up by 24,000 from 559,000 to 583,000. With these revisions, employment in April and May combined is 15,000 higher than previously reported. Monthly revisions result from additional reports received from businesses and government agencies since the last published estimates and from the recalculation of seasonal factors.

The June data was encouraging after disappointing gains in April and

Identifying Trends in CMS Skilled Nursing Penalties

The primary tool the Centers for Medicare & Medicaid Services (CMS) has for enforcing care standards at skilled nursing properties are civil monetary penalties (CMPs). CMPs are essentially fines for facilities found to be out of compliance with CMS care standards. Based on a national average, CMS penalties for skilled nursing properties had been on the rise from 2016 to the third quarter of 2019.  

The primary tool the Centers for Medicare & Medicaid Services (CMS) has for enforcing care standards at skilled nursing properties are civil monetary penalties (CMPs). CMPs are essentially fines for facilities found to be out of compliance with CMS care standards. Based on a national average, CMS penalties for skilled nursing properties had been on the rise from 2016 to the third quarter of 2019.  

Impact of the COVID-19 Public Health Emergency 

As the country began to grapple with the COVID-19 pandemic and the public health emergency was announced, average CMS penalties for skilled nursing properties declined. This is likely a reflection of the more collaborative, less-punitive surveys that took place while surveyors – the CMS regulatory staff who assess compliance with Medicare health and safety regulations – and operators alike learned about COVID-19 and its spread. 

A new federal government administration and a more thorough understanding of COVID-19 and the importance of strong infection control measures may mean that these penalties could be on the rise again, a trend that seemingly has already begun.   

Source: Data.cms.gov; Nursing Home Services Data Archive, 2016-2021

A Rise in Per-Incident Penalties 

Skilled nursing properties can be penalized through the imposition of a CMP for either the number of days that a facility has been out of compliance with a federal requirement (per-day or per-diem), for each instance of noncompliance (per-instance), or CMS can deny payments for new admissions. In 2017, guidelines were changed to set per-instance CMPs, rather than per-day, as the default penalty. Per-day penalties are often applied retrospectively and can accumulate to significant fines. Although per-day penalties remained the recommended approach for major violations, their overall use has been curtailed substantially.  

This transition has meant that the total amount of fines collected through per-incident penalties increased more than eight-fold from 2016 to 2020 and are projected to be even higher at the completion of the 2021 fiscal year (on September 30, 2021). As per-day penalties can be applied retrospectively and accumulate to significant amounts, operators benefitted during these years, as they were sheltered from penalties above the per-incident maximum fine of $20,965. There is no cap on the accumulation of per-day penalties. The Center for Medicare Advocacy has opposed the switch to per-incident fines and has been working to reverse what it considers to be efforts to roll back skilled nursing resident protections.  

Source: CMS Quality, Certification, & Oversight (QCOR) Reports 

At the time of the policy change, Dr. Kate Goodrich, director of clinical standards and quality at CMS, said in a statement that unnecessary regulation was the main concern that health care providers raised with officials. “Rather than spending quality time with their patients, the providers are spending time complying with regulations that get in the way of caring for their patients and doesn’t increase the quality of care they provide,” Dr. Goodrich said. 

With a new federal administration, high vaccination rates among skilled nursing residents, and the U.S. Senate confirmation of CMS Administrator Chiquita Brooks-LaSure, we could see a change in focus and policy and possibly a return to a stricter, and potentially costlier, enforcement. 

CMP’s Impact on Workforce and Labor 

Under current law, skilled nursing properties that are assessed civil monetary penalties above a certain threshold on their annual survey automatically lose their authority to train staff to be Certified Nursing Assistants (CNAs) for two years. With critical shortages in labor pools routinely being reported, particularly among CNAs, this penalty could have a major impact on a skilled nursing property’s staffing pipeline.  

In February 2019, the bi-partisan Nursing Home Workforce Quality Act was introduced, which would allow suspensions on in-house CNA education to be rescinded once the related deficiencies are remedied, albeit while allowing additional oversight of skilled nursing properties. The Nursing Home Workforce Quality Act did not receive a vote from the 119th Congress, and in-house CNA training programs can still be impacted by a certain level of civil monetary penalties, even if the fines are unrelated to the quality of care given to residents or if the care deficiencies cited on the survey are unrelated to the CNA training program.  

While penalties from CMS are an essential tool for ensuring skilled nursing properties are complying with care standards and are protecting their residents, both the approach and severity can be markedly different between administrations. A greater emphasis on infection control has broadened the scope of surveys, and subsequently the amount of time and resources involved in survey preparation. Without additional funding, a revival of more stringent surveys and quality standards could result in added annual costs for operators.  

Executive Survey Insights | Wave 29: May 17 to June 13, 2021

This Wave 29 survey includes responses collected May 17 to June 13, 2021 from owners and executives of 75 small, medium, and large seniors housing and skilled nursing operators from across the nation, representing hundreds of buildings and thousands of units across respondents’ portfolios of properties.

“Recent data from NIC’s Executive Survey Insights, NIC MAP® Data, powered by NIC MAP Vision, and NIC Analytics suggest that cautious optimism may be justified as occupancy rates appear to have reached their low points around the end of March and are gradually improving for many operators of seniors housing and care properties across the nation. Between 48% and 71% of organizations reported upward changes in occupancy depending on the type of care segment. Of note, more than a third of organizations with assisted living residences and nearly one-half with nursing care beds saw occupancy increases of three percentage points or more. Amidst this good news, seniors housing and care occupancy rates remain at historic lows, and the number one challenge currently facing operators is attracting community/caregiving staff. 

–Lana Peck, Senior Principal, NIC


NIC’s Executive Survey of operators in seniors housing and skilled nursing is designed to deliver transparency into market fundamentals in the seniors housing and care space as market conditions continue to change. This Wave 29 survey includes responses collected May 17 to June 13, 2021 from owners and executives of 75 small, medium, and large seniors housing and skilled nursing operators from across the nation, representing hundreds of buildings and thousands of units across respondents’ portfolios of properties.

Detailed reports for each “wave” of the survey and a PDF of the report charts can be found on the NIC COVID-19 Resource Center webpage under Executive Survey Insights.


Wave 29 Summary of Insights and Findings

  • Nine out of ten organizations report an increase in lead volume since the beginning of the year (91%), and one-third are seeing lead volume currently above pre-pandemic levels (34%). A clear trend in the rising pace of move-ins began around the Wave 25 survey conducted at the end of March (however, this trend occurred sooner for the nursing care segment).
  • Between two-thirds and one-half of respondents note that the pace of move-ins accelerated in the past 30-days. The shares of organizations reporting acceleration in the pace of move-ins were highest for the nursing care (66%) and assisted living care segments (62%) and the lowest for the memory care segment (49%). The nursing care segment saw the largest share of organizations reporting acceleration in move-ins (66%) since the beginning of the survey in March 2020.

  • Increased resident demand has been cited by nine out of ten respondents as a reason for acceleration in move-ins since the Wave 25 survey (around the time occupancy rates may have reached bottom). Since then, the average rates of resident and staff vaccinations have leveled off at around nine out of ten residents and two out of three staff.

  • The Wave 29 survey data continued to show improving trends in the percentages of organizations reporting higher occupancy rates, and each of the care segments (except independent living) set new peaks in the time series. Between 48% and 71% of organizations reported upward changes in occupancy depending on the type of care segment.

  • However, the degrees of occupancy change vary. As referenced in the section above, occupancy increases in organizations with assisted living, memory care and/or nursing care beds peaked in the Wave 29 survey. However, as shown in the chart below, occupancy increases were relatively small (between 0.1 and 3 percentage points) for the independent living and memory care segments. Of note, more than a third of organizations with assisted living residences (36%) and nearly one-half (47%) with nursing care beds saw occupancy increases of three percentage points or more.

  • While rent concessions may be helping to bolster occupancy rates, they are by no means the primary reason for occupancy rate increases as the percentages of organizations offering rent concessions has not increased significantly since last summer (2020) when we began tracking the data. In Wave 29, under half (45%) of respondent organizations were offering rent concessions to attract new residents. As in the prior three waves of the survey, most were discounting monthly rents (78%), and more than half (56%) were offering free rent for a specified period.

  • Since the Wave 27 survey conducted in the latter half of April, the share of organizations experiencing staffing shortages in their properties has leveled off around 90%, and roughly two-thirds of organizations (64%) with multiple properties have had staffing shortages in more than one-half of their properties.

  • Since the Wave 27 and 28 surveys, to attract staff, most respondent organizations are increasing wages, offering referral bonuses, and offering hiring/sign-on bonuses. Staff wages and benefits are typically the most significant operating expenses for seniors housing and care providers. As a result, and coupled with months of receding occupancy rates that had fallen to historic lows in the first quarter of 2021, NOI has been squeezed by the efforts to replace workers who left the labor force during the pandemic.
  • The single biggest challenge operators are facing at this point in the pandemic are attracting community/caregiving staff (45%), followed by low occupancy rates (31%), and staff turnover (14%). The Wave 30 survey will seek to provide greater insight into the tactics operators are finding are the most effective methods of attracting new community staff today.

Wave 29 Survey Demographics

  • Responses were collected between May 17 to June 13, 2021 from owners and executives of 75 seniors housing and skilled nursing operators from across the nation. Owner/operators with 1 to 10 properties comprise 64% of the sample. Operators with 11 to 25 and 26 properties or more make up 36% of the sample (21% and 15%, respectively).
  • One-half of respondents are exclusively for-profit providers (50%), and 50% operate both not-for-profit (42%) and for-profit (8%) seniors housing and care organizations.
  • Many respondents in the sample report operating combinations of property types. Across their entire portfolios of properties, 63% of the organizations operate seniors housing properties (IL, AL, MC), 24% operate nursing care properties, and 41% operate CCRCs (aka Life Plan Communities).

Owners and C-suite executives of seniors housing and care properties, please help us tell an accurate story about our industry’s performance.  

The current survey is available and takes 5 minutes to complete. If you are an owner or C-suite executive of seniors housing and care and have not received an email invitation to take the survey, please click this link, which will take you there.

NIC wishes to thank survey respondents for their valuable input and continuing support for this effort to bring clarity and create a comprehensive and honest narrative in the seniors housing and care space at a time when trends are continuing to change in our sector.

Length of Stay and the Importance of Measuring Net Worth in Senior Housing Market Selection

Whether a development or acquisition strategy is proactively market-driven by identifying specific markets that meet pre-determined criteria, or reactive by reviewing a specific property’s characteristics (such as size, unit count, asking rents and programmatic features), data on demographic, psychographic, and wealth characteristics of potential new residents is critical.

NIC’s recent acquisition of VisionLTC and the creation of NIC MAP Vision integrates the market-leading NIC MAP® Data Service with VisionLTC’s best-in-class data for investors, owners, and operators to provide significantly deeper and broader data for industry stakeholders. This article highlights one of the data concepts available to clients.

Key Takeaway: Typically, in seniors housing market feasibility studies, the target demographic is qualified by households or individuals that can afford to pay the minimum or average annual rent charged by a property. Depending upon the property type under consideration, a simple annual income qualification search metric alone may not always be sufficient—and may return different results.

Some Context: Whether a development or acquisition strategy is proactively market-driven by identifying specific markets that meet pre-determined criteria, or reactive by reviewing a specific property’s characteristics (such as size, unit count, asking rents and programmatic features), data on demographic, psychographic, and wealth characteristics of potential new residents is critical. Gathering data on household net worth (“wealth”) can be particularly challenging but is an essential data point in quantifying a target market with accuracy. An analysis of average annual household income in both a primary market area (PMA) and its respective metropolitan area provides insights into the scale of available purchasing power—but understanding household net worth is also crucial to accurately assessing the marketability of seniors housing to prospective residents—especially when average length of stay by property type is considered.

Financial Resources and Length of Stay (LOS)

Typically, in seniors housing market feasibility studies, target market depth is quantified by whether qualified households or individuals can afford to pay the minimum or average annual rent charged by a property. The metrics commonly used are thresholds for income-qualified age cohorts for either households or individuals. Home value is also often considered because the sale of a home may be used to subsidize the cost of residency. However, there is often a considerable difference between a property’s minimum or average rent (annualized) and the average annual income of age-qualified households when including a consideration of the estimated length of stay to determine how long a typical resident’s financial resources will allow them to live at the community.

The income streams of seniors include earnings, pensions and annuities, Veteran’s payments, alimony, Social Security, retirement savings, assets such as vehicles and other investments such as stocks, IRAs and bonds. These income streams alone do not make up all of a household’s financial resources, however. Housing equity net of mortgage debt is an important source of capital often used to support a move to seniors housing. Combined, these financial resources make up net worth. Unfortunately, obtaining net worth data is challenging at best, especially information on the housing equity component. The U.S Census Bureau’s decennial census and its yearly American Community Survey (ACS) do not measure net worth. And, while the U.S. Census Bureau’s Survey of Income and Program Participation tracks a wide variety of wealth-related data points, it does so only at the national level.

According to the State of Seniors Housing 2020 report, seniors housing median length of stay rates vary widely from 4.8 years (58.0 months) for CCRC residents to 1.4 years (17.1 months) for memory care residents. Therefore, net worth data, which considers all of a potential resident’s financial assets, may be a better source in selecting markets in terms of ability to pay a property’s fees for an estimated duration of residency than average annual income based on one year of minimum or average rents alone.

Seniors often combine income and assets (including the proceeds of home sales) to fund residency in seniors housing—and this is especially true for Continuing Care Retirement Communities (CCRCs, also referred to as life plan communities) which typically attract younger, healthier residents who plan to age in place (across the continuum of care from independent living to nursing care) for a longer period of time than residents that enter senior living with higher levels of care needs. In fact, the relatively newly designated term “life plan communities” is based on the concept that most residents in CCRCs are planners and have adequate savings to take them through retirement.

The primary payment source for CCRCs is the resident’s income and assets. Additionally, the value and liquidity of prospective residents’ houses are particularly important factors in their ability to afford an entrance-fee CCRC.

Different Measures, Different Outcomes: CCRCs Example

To illustrate different outcomes in broad market selection based on minimum annual income or net worth, the comprehensive datasets provided by NIC MAP and Vision LTC, powered by NIC MAP Vision, in combination with a unique subset of its 4,000-plus data points related to senior housing demand was used to develop a select subset of the top 929 MSAs across the country (Metropolitan Statistical Areas) based on relative target market depth (excluding supply), quantified in two different ways (Tables A & B).

Pre-Determined Target Market Selection Criteria:

  • Age: Households age 75+
  • Markets: 4,000 or more Age-Qualified households
  • Length of Stay: Data sourced from The State of Seniors Housing, 2020
    • Median, all CCRCs excluding nursing care beds, 58.0 months
  • Annual Income (Table A): Minimum, based on annualized average monthly rent at CCRCs in 1Q 2021
  • Net Worth (Table B): Minimum, based on CCRC average entrance fee, average length of Stay (LOS), and annualized average monthly rent as of 1Q 2021
    • Includes markets with average home value of senior households equal to or higher than assumed minimum property entrance fee

As shown below, selecting markets for further analysis by ranking the top 20 markets by either the percentage of age-and income-qualified households (Table A) or by the percentage of net worth-qualified households (Table B) yields generally different outcomes (and some similarities highlighted in blue).

Although six markets were common in both scenarios, looking at the top 20 net worth-qualified markets expands the income-based selection to markets that can be reasonably expected to be able to support the typical resident’s entire stay in a CCRC.

Given the diversity of seniors housing property types and levels of care setting combinations, and wide range of specific turnover rates, any market selection exercise or market feasibility study can be made more accurate with net worth data than relying on annual income data alone.

Having access to a variety of data related to seniors housing markets puts you in the best position to make informed decisions. NIC MAP Vision’s deep database of data points allows the analyst to search for any target market with unparalleled specificity—and creativity—and investment decisions with enhanced accuracy.

Interested in learning more about the data used in this analysis?

To learn more about NIC MAP and VisionLTC data, powered by NIC MAP Vision, and about accessing the data featured in this article, schedule a meeting with a product expert today.