Dramatic Moments: 30 Years of Investment in Seniors Housing and Care Part 2

In “Dramatic Moments in History: Another Period of Disruption,” Kurt Read, Chair of Board of Directors, NIC; and Principal, RSF Partners; provided attendees of the 2020 NIC Fall Conference with a review of the seniors housing and care industry’s performance characteristics since NIC was founded in 1991.

In “Dramatic Moments in History: Another Period of Disruption, Kurt Read, Chair of Board of Directors, NIC; and Principal, RSF Partners; provided attendees of the 2020 NIC Fall Conference with a review of the seniors housing and care industry’s performance characteristics since NIC was founded in 1991. This is the second of a series of three NIC Notes posts that provide the key takeaways from that session which reviewed the past 30 years of investment in seniors housing and care. 

AdobeStock_236389634-1

Development Cycles 

Another way to look at the past 30 years, is to see how this relatively new industry has development cycles, driven by the need to meet growing demand. Read analyzed three distinct cycles, which have occurred since 1991. During the savings and loan boom, cash flowed into real estate. Seniors housing developed at more than double the pace of preceding years. While the boom created oversupply, it also fueled entrepreneurial efforts to improve seniors housing models and products.  

Read recalled a meeting with Bill Colson and Norm Brenden, in 1991, just as the crisis hit, and capital was fleeing the sector. Their company, Holiday Retirement, was looking for capital. “Oh my goodness, did they have a great product. They had consumers, during this time period, during a recession, moving into their properties…they were developing at a 90% occupancy to a 15% unlevered return on cost.” Although other investors “beat us to the punch” on the opportunity, he pointed to this as an example of how, “During a period of disruption, if you have a great product that can earn a really good return for the risk, you’re going to raise capital.” He pointed out that other great companies in the space, such as Sunrise Senior Living and Erickson Living, were able to access capital in the late ‘80’s and early ‘90s, launching their rise, even amid a major disruption in the space. 

During the IPO boom of the mid ‘90s, capital was again flooding into the sector. Read recalled hearing IPO pitches for “newfangled” assisted living properties. “When they got to the part about their growth plans, I could tell this was not going to end well.” Companies were planning to open new properties at an unrealistic pace, and the result, according to Read, was, “too many properties, being built too quickly, in too few markets. We had a huge overhang from that.” As was the case in the previous crisis, new supply fell off dramatically as a result. 

Going into the Great Financial Crisis, there was less supply growth. “That was part of the story for why we had such great performance, relative to other real estate asset classes,” explained Read. New inventory volumes dropped again in 2010-2012. “That set us up for a wonderful period of outperformance. We had better returns than other asset classes. We had demand growth. Capital was available, and here we go – another development boom.” As more new properties came on the market, through the end of the decade, occupancy rates grew, then flattened, then softened on a national basis. Despite record demand, absorption couldn’t keep up with the burgeoning supply.  

Buying Low 

Looking at all three of the economic crises outlined in our first NIC Notes post, Read observed three distinct opportunities to buy quality properties at lower prices. “You put periods of disruption together with a highly cyclical development flow and money flow into our space, and what you get are some really interesting opportunities.” In the savings and loan crisis, many opportunities existed to buy quality assets at low prices. Read’s company acquired a public company, the Forum Group, with “wonderful Class A assets, 26 of them, they had just been built during the easy money times. They were a creation of a firm you may have heard of: Drexel Burnham Lambert.” That company, run by the now infamous Michael Milken, had overfinanced the senior living company which had developed most of its properties.  “Financing new development with current pay junk bonds was not a recipe for success.” Recapitalized, the properties were able to get through the recession. “It was a very successful investment for us,” said Read.  

The healthcare real estate crisis also produced buying opportunities, generated by oversupply and a disrupted revenue model in skilled nursing. As C-corps and REITs suffered low occupancy rates, missed lease-up targets, and, simultaneously, skilled nursing operators began to miss lease payments, investors saw opportunities to buy stocks, bonds, bank debt, assets, and companies. As in the former crisis, development fell off significantly. In that environment, many companies were able to acquire assets at low prices and achieve great success. “It was a terrific time to be buying brand new, disrupted private-pay senior housing. Some of the best institutional investors made really great use of this time period and developed incredible track records as savvy purchasers, owners, and managers of senior living assets at this time.”  

Keep Your Eye on Capital Flows 

During the broad financial disruption of the Great Financial Crisis, the senior living industry looked very strong, relative to other real estate asset classes. “The healthcare REIT sector of public REITs was the largest sector by market cap during this time. Bigger than malls, bigger than office buildings, because we were doing so well relative to the other real estate asset classes. This really set up a period of outperformance for our industry. We had demand growth, we had reasonable supply/demand balance, we had good returns, we didn’t suffer during the GFC. Wow, this looked like a great place for people to rotate their capital to, and indeed they did.” 

According to Read, “the takeaway from this is, keep your eye on capital flows into our industry. It’s really a small industry relative to other real estate asset classes. When you see that supply curve bending up and to the right, you’ve got to put your radar up, because we’ve had big cycles in this space. If you think about it, we’re a real estate sector, we’re a healthcare sector, and we’re a hospitality sector. You put those three things together and there are more chances for disruption over a long period of time than there are for a more simple asset class, like industrial, to pick one.” 

Be Patient 

Looking at the NCREIF market value index over all three recessions, Read illustrated how much time it took to recover from each. Investors affected by the savings and loan crises didn’t gain back the value lost until eleven years later. He pointed out it also took 4-5 years to hit bottom. “You’ve got to be patient,” he said, “it was not a good idea to be wandering into the U.S. real estate market, buying a bunch of real estate in the first couple of years of the savings and loan crisis…you had to wait until you got to 1992 before you could plow in.” The Great Financial Crisis, despite sharp declines, took two years to bottom out. “You hear pontificators talk about “V” shaped recovery, ‘we’ll be back by Christmas’, all this nonsense, that’s not how real estate works,” said Read, “any crisis that affects real estate takes a while.” 

To further illustrate that point, Read examined distress cycles, revealing the lengthy process, from “shock and triage,” through a “price discovery” period, and then workouts and resolutions via distressed property transactions. “It takes time,” Read summarized, “It’s complicated and slow.” 

Dramatic Moments Part 2 Image

Dramatic Moments: 30 Years of Investment in Seniors Housing and Care Part 1

While much of the programming for the recent 2020 NIC Fall Conference focused on the pressing issues of today, particularly during a time of COVID-19, economic and political uncertainty, and disruption, one session stepped back, and looked at what is happening today through a lens that stretches back to 1991.

While much of the programming for the recent 2020 NIC Fall Conference focused on the pressing issues of today, particularly during a time of COVID-19, economic and political uncertainty, and disruption, one session stepped back, and looked at what is happening today through a lens that stretches back to 1991. This is the first of a series of three NIC Notes posts that share the key takeaways from that session which reviewed the past 30 years of investment in seniors housing and care. 

AdobeStock_163119306-1

In “Dramatic Moments in History: Another Period of Disruption,” Kurt Read, Chair of Board of Directors, NICand Principal, RSF Partnersprovided a review of the seniors housing and care industry’s performance characteristics over those last three decades. Following his professorial, yet highly practical, and accessible retrospective presentation he introduced past, present, and future leaders of NIC, to comment on what the organization has achieved over its nearly 30 year history – and where it is leading the industry in coming years.  

Crammed with original charts, and many examples pulled from his own experiences as a long-time investor in the industry, Read’s presentation was a guided tour, pointing out key facts and figures through recessions, building booms, floods of capital both into and out of the industry, major disruptions, and the current worldwide pandemic. The overall effect was of a master class, not to be missed by anyone with an interest in the sector.  

Rising Demand and Falling Rates 

“When you do something for 30 years, it gives you a chance to accumulate a lot of experiences,” Read said, as he launched a series of slides outlining the history of seniors housing and care since 1991, when NIC was founded. He relayed plenty of those experiences as illustrations and examples, throughout the presentation of data, lending a human aspect to the events of the past three decades. He began his remarks with two theses for investment in the sector: “This is a space that benefits, very simply, from increasing demand…and the ‘lucky’ trend that…interest rates have declined over the last 30 years.” The chart showed the rise of the 80+ population from 7 to nearly 14 million over that time, and the 10-year treasury yield over the same period, dropping from over 8.5% to under 1%. Noting the ups and downs of the interest rates over time, as well as the multiple recessions, he said, “It’s not easy, it’s never smooth, but that volatility and those periods of disruption provide for both great challenges and opportunities.” 

In addition to reviewing how disruptions and recessions have yielded opportunities for investors, Read said he also wanted to dig into the characteristics of a disruption, “particularly as it pertains to an illiquid, lumpy asset class like real estate and seniors housing and care as a subset of that.” One of Read’s goals for the presentation was to ask whether the things the industry was “saying and doing right before the pandemic started” were still true today. Another goal, Read explained, was to “spend time with the leaders of NIC over the years and going forward…hear directly from them, in their voices, why they believe NIC is really the collective expression of all of our passion and dedication to this industry, in our effort to provide great environments, and to provide great care to our nation’s elders.” 

Four Major Disruptions 

He started with the four major disruptions which have occurred over the last 30 years, observing that, “there are exogenous factors, government actions, that disrupt markets, that have direct consequences, and indirect consequences.” In the savings and loan crisis of 1986 to 1995, in an effort to stamp out high inflation, the government raised interest rates. “On paper that bankrupted the savings and loan industry almost overnight,” Read said. Ultimately, hastened by the government’s actions to try to help the savings and loans, the real estate industry saw “a torrent of capital into the real estate business, that quickly became speculative.” That lead to a bubble, which then burst, and took investors many years to recover from. 

Ten years later, from 1998 to 2001, in the healthcare real estate crisis, skilled nursing was disrupted by a major shift to the fee-for-service reimbursement model, which was poorly managed by the government. A simultaneous boom in IPOs caused a glut of new construction in assisted living. “Those two forces collided to disrupt both C-corps and healthcare REITS, many of which were public.” The crisis played out in the public markets, in real time. “It was immediately apparent that there was enormous distress in the markets.” Confidence in senior living dropped and capital fled the sector. “This led to a number of very interesting opportunities, but it was a period of great pain and disruption for our industry.” 

In the great financial crisis of 2008 to 2009, overinvestment and excessive leverage in residential and commercial real estate caused a bubble. When the bubble collapsed, the government stepped in to help stabilize financial markets. There were fewer mark-to-market opportunities as a result. “It gave us an opportunity to shine. We looked pretty good, relative to the rest of the real estate world.” 

On the current crisis, Read said, “Here we are in a healthcare crisis, prompting incredibly uneven effects across our industry, as skilled nursing facilities are effected dramatically differently from other types of facilities in our space. We are just at the beginning. It’s very unclear where we are going to go from here.”  

NIC’s Skilled Nursing COVID-19 Tracker Shows Worrying Pace of Cases Across the U.S.

Since May 31, 2020, NIC has been publishing a regular updated weekly surveillance report on the incidence of COVID-19 cases among residents in our nation’s nursing care properties.

Since May 31, 2020, NIC has been publishing a regular updated weekly surveillance report on the incidence of COVID-19 cases among residents in our nation’s nursing care properties. Using raw data collected and reported by the Centers for Medicare & Medicaid Services (CMS), NIC’s Skilled Nursing COVID-19 Tracker (Tracker) reports CMS nursing home data and provides insights into the rate of virus spread within skilled nursing properties.

The Tracker is an easy-to-use interactive visualization tool that shows where cases are spreading, slowing, or remaining flat. In addition, the Tracker provides charts and tables that depict the incremental week-over-week change rate in three important metrics on a same-store basis, i.e. the same nursing properties are tracked each week across regions, sub-regions, states, and counties. The metrics include: (1) new COVID-19 confirmed cases per same store properties, (2) new COVID-19 confirmed cases as a share of residents, and (3) occupancy rates (based on CMS Data). Importantly, the Tracker allows users to drill down to a smaller market or a specific property and access the underlying data. The Tracker is available in the NIC COVID-19 Resource Center.

As a backdrop, COVID-19 cases are accelerating at a worrying pace across the U.S. and alarming new records are being set every day. According to the Johns Hopkins Coronavirus Resource Center, there were 11,065,237 cases in the U.S. as of November 16, 2020, and 246,626 deaths. This is up from 8,833,396 and 227,000, respectively, as recently as October 28, 2020. Moreover, there were 166,000 new cases and 73,014 hospitalizations reported on Monday, November 16, 2020 according to Johns Hopkins University and the COVID Tracking Project.

For the U.S., these figures represent 19% of the world’s cases and deaths, a disproportionate amount for a nation that only represents 4.3% of the globe’s population. While the mortality rates associated with COVID have declined, the rising incidence rate is disturbing, particularly for operators of seniors housing and skilled nursing properties, given the health vulnerabilities and comorbidities of these populations. Further, staff of these properties have been relentless in their efforts to combat the virus and safeguard residents and a level of exhaustion and fatigue exists for virtually everyone. Unfortunately, heightened diligence is further warranted.

Exhibit 1 – Source: NIC Skilled Nursing COVID-19 Tracker*

The Tracker shows that new infections are on the rise across skilled nursing properties, but the coronavirus hot spots are changing over time within the four regions of the U.S.—Midwest, Northeast, South and West. The trends depicted in Exhibit 1 show when each of the regions peaked in terms of COVID-19 confirmed cases as a share of residents. The number of new cases was highest in the Northeast in late May and reached 1.35% of residents testing positive, whereas the South and West regions peaked in late July and reported 1.50% and 1.29% of new confirmed cases as a share of residents, respectively.

For the week ending November 1, the Tracker shows that positivity rates are increasing dramatically and reaching very undesirable numbers in the Midwest. In the Midwest, all 12 states saw an increase in new COVID-19 confirmed cases from the prior week (October 25). The data also show new confirmed cases in skilled nursing properties reached a record high in the Midwest: 4,688 new cases within 4,499 facilities, or the equivalent to 1.66% of newly confirmed cases among residents. The South reported the second highest rate of 0.91%, followed by the West (0.58%) and Northeast (0.37%).

Although the West and Northeast reported cases remain relatively low compared to the Midwest and South regions, the Northeast saw an uptick in new confirmed cases on November 1, increasing by nearly 0.2% from the week ending October 11. Just like the overall new confirmed cases across the country rising to new records, the new confirmed cases in skilled nursing properties hit new highs on November 1, nearly 1% of residents testing positive within the U.S. skilled nursing properties.

Because of this outbreak of COVID-19 cases, new rules are being reimposed across the U.S. These requirements include more frequent testing, greater emphasis on physical distancing, and masking guidelines. These restrictions continue to be the best weapon against the virus until a vaccine is approved and widely distributed.

The U.S. map in Exhibit 2 below shows the week-over-week change in new COVID-19 confirmed cases as a share of residents within skilled nursing properties by state, as of November 1. Over 40 states showed an increase in new confirmed cases from the prior week (October 25). 

Exhibit 2 – Source: NIC Skilled Nursing COVID-19 Tracker*

To gain in-depth insights and track the week-over-week change rate for new resident cases of COVID-19 within skilled nursing properties, visit NIC.org. You can also access the Skilled Nursing COVID-19 Tracker along with a rich trove of analysis and insight on the NIC COVID-19 Resource Center.

NIC is committed to provide data, analyses and insights that increase transparency and understanding of the sector, especially in this difficult time of COVID-19. We strongly support all actions and efforts that prioritize testing and availability of PPE to protect frontline workers and residents.


*CMS Data – As of November 1

Executive Survey Insights | Wave 15: October 26 to November 8, 2020

This NIC Executive Survey Insights Wave 15 survey includes responses collected October 26-November 8, 2020 from owners and executives of 64 seniors housing and skilled nursing operators from across the nation.

“A key underlying theme that can be derived from looking at the findings of the Wave 15 NIC Executive Insights survey as a whole is uncertainty. Uncertainty around the need for seniors housing and care operators to use temporary and agency staff, ability to grow NOI amid rising costs of labor and PPE, the pace of sales in light of consumer concerns about being able to visit loved ones, and the direction of record low occupancy rates. When (and how) life as we knew it will settle into a new normal are all being driven by the durability of the pandemic.”      –Lana Peck, Senior Principal, NIC


NIC’s Executive Survey of operators in seniors housing and skilled nursing is designed to deliver transparency into market fundamentals in the seniors housing and care space at a time when market conditions continue to change. This Wave 15 survey includes responses collected October 26-November 8, 2020 from owners and executives of 64 seniors housing and skilled nursing operators from across the nation. Detailed reports for each “wave” of the survey can be found on the NIC COVID-19 Resource Center webpage under Executive Survey Insights.

 Wave 15 Summary of Insights and Findings

  • Staffing is a growing challenge for many operators. More than two-thirds of respondents are using agency or temp staff to fill vacancies—70% up from 36% in Wave 3. Although down slightly from Wave 14, most respondents are continuing to pay staff overtime hours, putting ongoing strain on NOI. While fewer organizations in Wave 15 than earlier in the pandemic continue to allow staff to work remotely and offer paid sick leave, three-quarters are still offering flexible work hours.
  • In Wave 15, similar shares of organizations with independent living units, assisted living units and/or nursing care beds reported roughly equal proportions of increases or decreases in month-over-month occupancy changes.
  • The use of rent concessions may be providing some support to occupancy rates as month-over-month seniors housing care segment occupancy changes in Waves 14 and 15 trended higher than prior in waves of the survey. Between 62% and 69% of organizations with any independent living units, assisted living units and/or memory care beds reported offering rent concessions. Fewer organizations with any nursing care beds reported offering rent concessions (43%).
  • The shares of organizations with assisted living units reporting increased month-over-month occupancy is the highest in the survey time series (42%). Just under one-half of organizations with memory care units (45%), 40% with nursing care beds, and roughly one-third with independent living units (30%) noted upward changes in occupancy rates in the past 30-days. Regarding the change in occupancy from one week ago, between two-thirds and three-quarters of organizations (63% to 79%) reported no change.
  • The shares of organizations reporting no change in the pace of move-ins and move-outs in the past 30-days for the independent living, assisted living and memory care segments remained high in Wave 15 (between 49% and 52%). That said, while smaller in proportion, the shares of organizations reporting accelerations in move-ins outpaced decelerations in the independent living, assisted living and memory care segments. However, the nursing care segment had the largest share of organizations reporting both a deceleration in the pace of move-ins and acceleration in the pace of move-outs in the past 30-days.
  • The share of organizations citing increased resident demand as a reason for acceleration in move-ins in Wave 15 also remained high. Organizations citing hospital placement in Wave 15 (29%) is up from a low of 13% in Wave 12 and down from a high of 41% in Wave 10. Resident or family member concerns was cited most frequently as a reason for deceleration in move-ins and reached the highest point in the survey time series (88%), followed by slowdown in leads conversions/sales (75%). Interestingly, there appears to be a relationship between these two primary reasons.
  • Respondents citing an organization-imposed ban as a reason for deceleration in move-ins increased from 0% in Wave 14 to 17% in Wave 15. While still a small percentage, about one in five respondents (19%) indicated their organizations were increasing move-in restrictions in one or more of their properties. This is up from an average of 7% in Waves 11 through 14 (surveyed early August to the end of October).
  • One-third of organizations with nursing care beds (33%) reported an acceleration in the pace of move-outs. This was the largest share since the Wave 5 surveyed in late April to early May.
  • Three-quarters of organizations (77%) reporting acceleration in move-outs cited resident deaths (reason unspecified), which was up from 61% in Wave 13. Resident or family member concerns declined from 52% in Wave 13 to 45% in Wave 15, followed by residents moving to higher levels of care (41%).
  • Accurate and timely testing (within 48 hours) and access to PPE is crucial for operators to keep residents safe from contagion and grow occupancy. Over one-half of respondents find it easy to obtain COVID-19 test kits and PPE. A significant improvement since the late summer months, more than one-half of respondents (56%), received their COVID-19 test results within 2 days, up from 13% in Wave 10, surveyed late July to early August.
  • About one-quarter of organizations (24%)—more than in the Wave 10 survey (13%) and similar to the Wave 3 survey (27%)—expect their development pipelines to decrease. The reason cited by all of the respondents was uncertainty.

Wave 15 Survey Demographics

  • Responses were collected October 26-November 8, 2020 from owners and executives of 64 seniors housing and skilled nursing operators from across the nation. Half of respondents are exclusively for-profit providers (52%), one-third (33%) are exclusively nonprofit providers, and 15% operate both for-profit and nonprofit seniors housing and care organizations.
  • Owner/operators with 1 to 10 properties comprise 56% of the sample. Operators with 11 to 25 properties make up 24% of the sample, while operators with 26 properties or more make up 20% of the sample.
  • Many respondents in the sample report operating combinations of property types. Across their entire portfolios of properties, 72% of the organizations operate seniors housing properties (IL, AL, MC), 33% operate nursing care properties, and 33% operate CCRCs (aka Life Plan Communities).

Key Survey Results

Pace of Move-Ins and Move-Outs

Respondents were asked: “Considering my organization’s entire portfolio of properties, overall, the pace of move-ins and move-outs by care segment in the past 30-days has…”

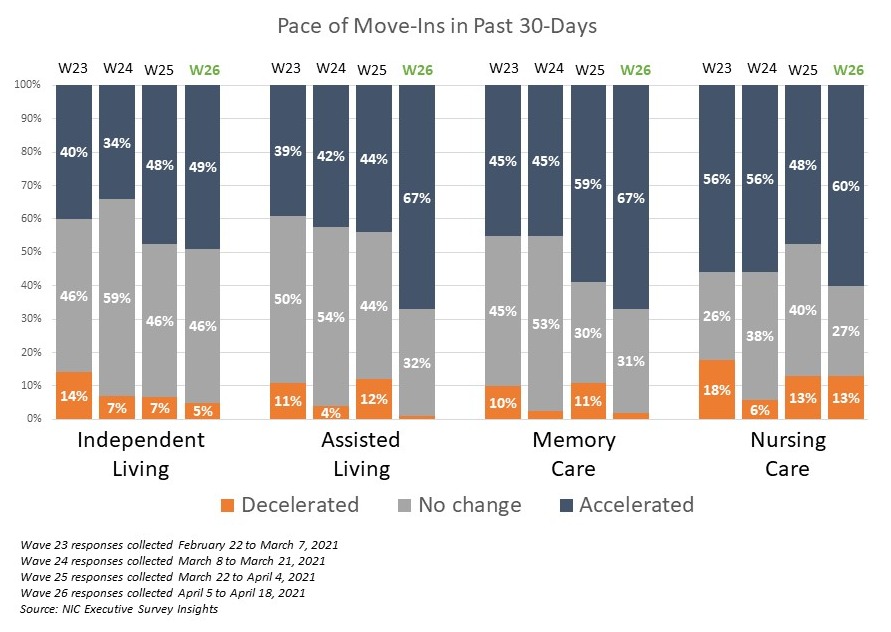
  • Showing the most recent waves of survey data in the chart below, the shares of organizations reporting no change in the pace of move-ins in the past 30-days remained high for the independent living, assisted living and memory care segments (ranging from 49% to 52%).
  • Between one-quarter and one-third of organizations (25% to 34%) with independent living, assisted living and/or memory care units, and 19% of organizations with nursing care beds reported accelerations in the pace of move-ins. Accelerations outpaced decelerations in assisted living and memory care. The nursing care segment had the largest share of organizations reporting declaration in move-ins.
  • Wave 15, the smallest shares of organizations with independent living units and/or nursing care beds reported accelerations in the pace of move-ins, and the largest shares of organizations with nursing care beds reported decelerations in the pace of move-ins since Wave 8 (surveyed at the end of May to early June).

Reasons for Acceleration or Deceleration in Move-Ins

Respondents were asked: “The acceleration/deceleration in move-ins is due to…”

    • The share of organizations citing increased resident demand as a reason for acceleration in move-ins in Wave 15 remained high (71%); up from a low of 66% in Wave 10 (surveyed mid-July to early-August) but down from a peak of 88% in Wave 12 (surveyed mid- to late-September). Organizations citing hospital placement in Wave 15 (29%) is up from a low of 13% in Wave 12 and down from a high of 41% in Wave 10.

  • Resident or family member concerns cited as a reason for deceleration in move-ins in the past 30-days reached the highest point in the survey time series (88%), followed by slowdown in leads conversions/sales (75%). Interestingly, there appears to be a relationship between these two primary reasons.
  • While government-imposed ban cited as a reason for deceleration in move-ins remained steady from the prior wave (25%), respondents citing organization-imposed ban increased from 0% in Wave 14 to 17% in Wave 15.

  • Between two-thirds and three-quarters of organizations in Wave 15 (63% to 76%) with independent living, assisted living, and/or memory care units note no change in the pace of move-outs in the past 30-days. While greater shares of organizations with independent living units reported deceleration in move-outs than in the prior three waves of the survey (20%), greater shares of organizations with assisted living units reported acceleration in move-outs than in the prior two waves (24%).
  • One-third of organizations with nursing care beds (33%) reported an acceleration in the pace of move-outs. This was the largest share since the Wave 5 surveyed in late-April to early-May.

  • Resident deaths (unspecified reason) were cited most frequently as a reason for acceleration in move-outs (77%). This is up from 61% in Wave 13. Resident or family member concerns declined from 52% in Wave 13 to 45% in Wave 15, followed by residents moving to higher levels of care (41%).

Change in Occupancy by Care Segment

Respondents were asked: “Considering the entire portfolio of properties, overall, my organization’s occupancy rates by care segment are… (Most Recent Occupancy, Occupancy One Month Ago, Occupancy One Week Ago, Percent 0-100)”

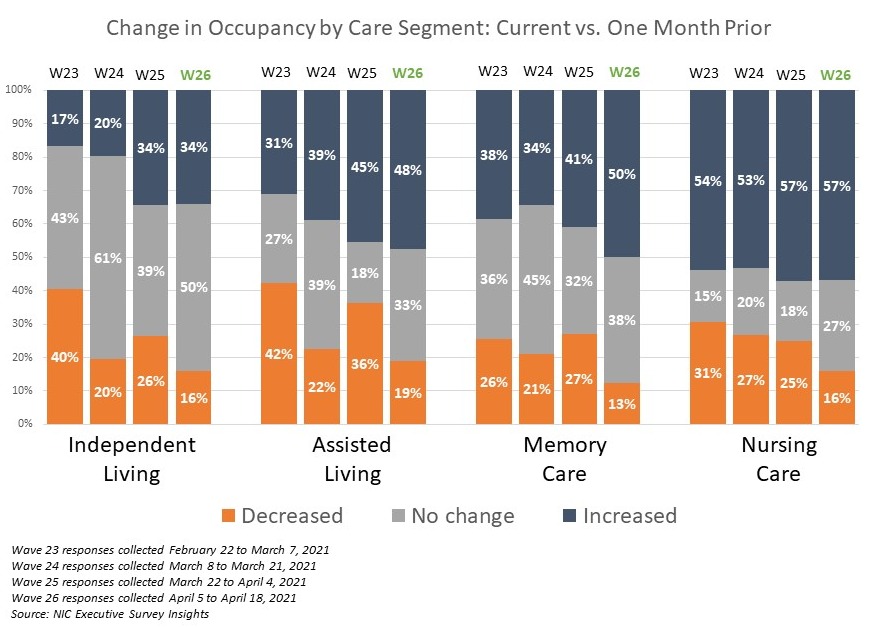
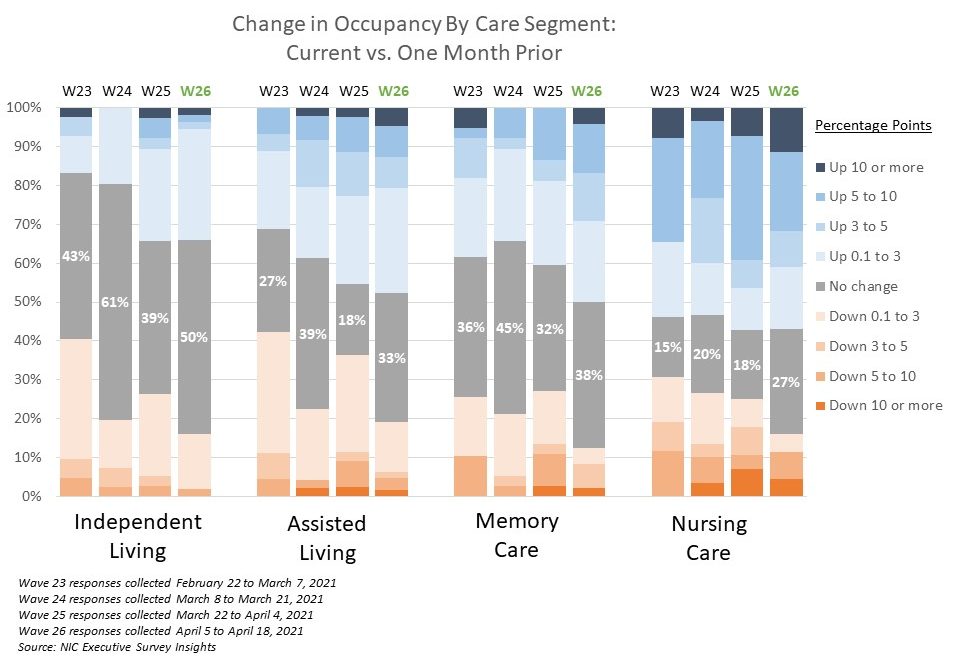
  • The shares of organizations with assisted living units reporting increased occupancy is the highest in the survey time series (42%). Just under one-half of organizations with memory care units (45%), 40% with nursing care beds, and roughly one-third with independent living units (30%) noted upward changes in occupancy rates in the past 30-days.
  • In Wave 15, similar shares of organizations with independent living units, assisted living units and/or nursing care beds reported roughly equal proportions of increases or decreases in month-over-month occupancy changes.

  • Regarding the change in occupancy from one week ago, between two-thirds and three-quarters (63% to 79%) of organizations reported no change. Among organizations with nursing care beds, slightly more reported declines than increases (23% vs. 13%). Occupancy increases were reported in similar proportions to the prior wave by organizations with independent living and/or assisted living units. There were no organizations with memory care units reporting declines in week-over-week occupancy.

Organizations Currently Offering Rent Concessions to Attract New Residents and Organizations Experiencing a Backlog of Residents Waiting to Move-In

Respondents were asked: “My organization is currently offering rent concessions to attract new residents,” and “My organization is experiencing a backlog of residents waiting to move-in”

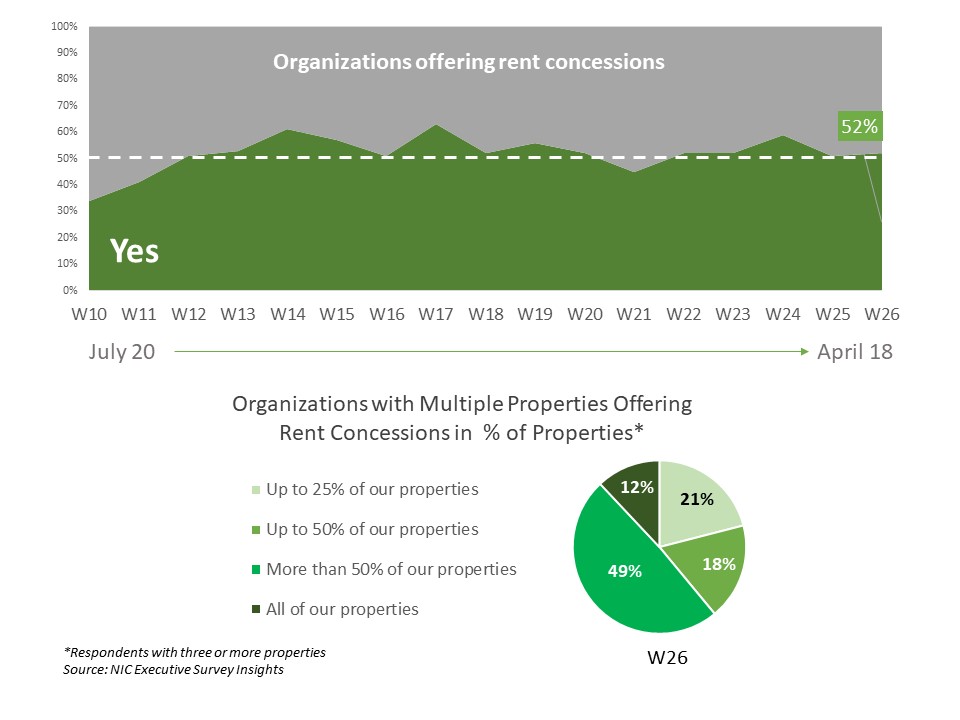
    • More than one-half of respondents in Wave 15 (57%) were offering rent concessions to attract new residents. Organizations offering rent concessions has been above 50% in the survey since mid-September.

  • Of the organizations that operate any independent living and/or memory care units (including a combination of other seniors housing and care segments), around two-thirds (69% and 64%, respectively) indicated they were currently offering rent concessions, followed by 62% of organizations with any assisted living units, and fewer than half of organizations with any nursing care beds (43%).
  • Separately, in NIC’s 2Q 2020 Actual Rates Report, the average discount for assisted living care units averaged 4.4% ($226) below average asking rates. This equates to an average initial rate discount of 0.5 month on an annualized basis. Learn More About the Actual Rates Initiative.
  • Approximately one-quarter of respondents (26%) indicate that their organizations have a backlog of residents waiting to move in. This has remained steady since Wave 12 surveyed mid- to late September.

Improvement in Access to PPE and COVID-19 Testing Kits

Respondents were asked: “Considering access to PPE (personal protective equipment) and COVID-19 testing kits, my organization has experienced that access has improved… Very little, it is still difficult to obtain enough PPE/testing kits in most markets/Somewhat, in some markets it is easier to obtain PPE/testing kits than in others/Considerably, we typically have no difficulty obtaining PPE/testing kits, regardless of market”

  • While there’s been some improvement in recent waves of the survey, just over one-half of respondents find it easy to obtain COVID-19 test kits. Respondents reporting easy access to PPE remains roughly one-half.

Time Frames for Receiving Back COVID-19 Test Results

Respondents were asked: “Regarding COVID-19 test results (either for staff, residents or prospective residents) results typically come back within…”

  • More than one-half of respondents (56%), received their COVID-19 test results within 2 days, up from 13% in Wave 10, surveyed late-July to early-August. Nearly all respondents (97%) received test results within 5 days.

Labor and Staffing

Respondents were asked: “My organization is backfilling property staffing shortages by utilizing … (Choose all that apply).” Note: this question was asked in Wave 3, and then again in Waves 10-14.

  • In Wave 15, more than two-thirds of respondents are using agency or temp staff to fill staffing vacancies—70% up from 36% in Wave 3. Although down slightly from Wave 14, most respondents (81%) are continuing to offer staff overtime hours.

 Supporting Property Staff

Respondents were asked: “My organization is supporting property staff who may be experiencing challenges by providing… (Choose all that apply)” Note: this question was asked only in the three survey time periods shown in the chart.

  • While fewer organizations in Wave 15 than earlier in the pandemic continue to allow staff to work remotely, three-quarters are still offering flexible work hours (78%). Additionally, fewer are offering additional paid sick leave.

Development Pipeline Considerations

Respondents were asked: “My organization’s projected development pipeline going forward is expected to… (Choose all that apply)” Note: this question was asked only in the three survey time periods shown in the chart.

  • About one-quarter of respondents (24%)—more than in the Wave 10 survey (13%) and similar to the Wave 3 survey (27%)—expect their development pipelines to decrease. The reason cited by all of the respondents was uncertainty.
  • One in five organizations in Wave 15 (20%) expect their development pipelines to increase. Reasons respondents cited for increase included lower interest rates, planned projects continuing to make progress, growth opportunities in the market, and favorable acquisition pricing.

Owners and C-suite executives of seniors housing and care properties, we’re asking for your input! By providing real-time insights to the longest running pulse of the industry survey you can help ensure the narrative on the seniors housing and care sector is accurate. By demonstrating transparency, you can help build trust.

“…a closely watched Covid-19-related weekly survey of…operators
conducted by the National Investment Center for Seniors Housing & Care…”

The Wall Street Journal | June 30, 2020

The Wave 16 survey is available until Sunday, November 22, and takes just 5 minutes to complete. If you are an owner or C-suite executive of seniors housing and care and have not received an email invitation to take the survey, please click this link or send a message to insight@nic.org to be added to the email distribution list.


NIC wishes to thank survey respondents for their valuable input and continuing support for this effort to bring clarity and transparency into market fundamentals in the seniors housing and care space at a time where trends are continuing to change.


3Q20 CCRC Care Segment Performance Better than Non-CCRCs, Year-Over-Year

As the leading data provider for the seniors housing and care sector, the NIC MAP® Data Service (NIC MAP) tracks occupancy, asking rents, demand, inventory and construction data for independent living, assisted living, memory care, skilled nursing and continuing care retirement communities (CCRCs)

As the leading data provider for the seniors housing and care sector, the NIC MAP® Data Service (NIC MAP) tracks occupancy, asking rents, demand, inventory and construction data for independent living, assisted living, memory care, skilled nursing and continuing care retirement communities (CCRCs), also referred to as life plan communities, for more than 15,000 properties across 140 metropolitan areas. NIC MAP currently tracks 1,208 not-for-profit and for-profit entrance fee and rental CCRCs in these 140 combined markets (1,137 in the 99 combined Primary and Secondary Markets).

CCRCs offer multiple care segments (at a minimum independent living and nursing care) typically by a single provider on one campus. This analysis breaks the care segment types apart from the CCRC community type that NIC MAP includes under the main category of seniors housing. Care segment type refers to each part or section of a property that provides a specific level of service, i.e., independent living, assisted living, memory care or nursing care. The following analysis examines current conditions and year-over-year changes in inventory, occupancy, and same store asking rent growth—by care segments within CCRCs (CCRC segments) compared to non-CCRC segments in freestanding or combined communities to focus a lens on the relative performance of care segments within CCRCs.

Current CCRC Occupancy by Payment Type and Profit Status

In the third quarter of 2020 (two quarters into the COVID-19 pandemic) CCRC occupancy, which is inclusive of stabilized and non-stabilized units, entrance fee and rental payment types, in both not-for-profit and for-profit communities across the Primary and Secondary Markets fell 260 basis points from 2Q 2020, when it was at its lowest point since NIC MAP began reporting the data (89.2%). Prior to the 2Q 2020 trough, CCRC occupancy oscillated around 91% for 22 consecutive quarters. Non-CCRC occupancy averaged 77.7% in 3Q 2020—a very wide 8.9 percentage points lower than CCRC occupancy. Entrance fee CCRC occupancy (89.0%) was 6.4 percentage points higher than rental CCRCs (82.6%), and not-for-profit CCRC occupancy (88.2%) was 6.0 percentage points higher than for-profit CCRCs (82.2%).

 
The wide discrepancies in occupancy rates during the COVID-19 pandemic are varied. They can be explained, in part, because new CCRC residents are generally healthier than residents in other types of seniors housing resulting in lower resident turnover in CCRCs. CCRCs also typically have larger campuses and differentiated residential environments separated by care segment—which may allow operators to mitigate spread of the virus by protecting more vulnerable populations in autonomous settings. Additionally, the contract stipulations of entrance fee CCRCs, which tend to be varied and unique, may attract retirees who may have been less inclined to move out during the pandemic. A special report from NIC’s Executive Survey Insights, regarding CCRC performance for two time periods during pandemic (March 24-April 12 and April 27-May 24) from owners and C-suite executives of operators of seniors housing and care properties across the country, can be found here for additional insights regarding move-in and move-out rates, and changes in occupancy.

ccrcchart1

Another potential reason for the difference in occupancy rates may be a result of the relative influence of the majority inventory mix in CCRCs compared to non-CCRC communities (freestanding and combined). As shown in the chart, in aggregate, CCRCs are comprised of a majority of independent living care segment units (55.4%), followed by nursing care units (27.0%), assisted living units (13.8%), and memory care units (3.8%). Compared to CCRCs, non-CCRCs have lower proportions of independent living care segment units (14.5%), and higher proportions of nursing care units (52.1%), assisted living units (24.7%) and memory care units (8.6%) than CCRCs. Thus, the overall CCRC occupancy rate, compared to the overall non-CCRC occupancy rate, may be influenced positively by majority unit mix.

ccrcchart2-1

CCRCs vs. Non-CCRCs in Detail

The CCRC independent living care segment (which represents 55.4% of CCRC units) garnered the highest occupancy in the third quarter of 2020 (90.4%), as well as the least drop in occupancy year-over-year, falling 2.2 percentage points. The current nursing care segment occupancy rate in non-CCRCs, which represents 52.1% of non-CCRC units, was much lower at 75.5%, and fell 10.4 percentage points year-over-year.

The table below compares each of the care segments—independent living, assisted living, memory care and nursing care—in the Primary and Secondary Markets. The table shows the 3Q 2020 total open units, occupancy and average monthly asking rent—and year-over-year changes for CCRCs and non-CCRCs.

 ccrcchart3

Click to Expand


Higher Occupancy at CCRCs

The CCRC independent living care segment had the highest 3Q 2020 occupancy (90.4%), followed by CCRC memory care (86.2%), assisted living (86.1%), and nursing care (79.0%). Among non-CCRCs, the independent living care segment had the highest 3Q 2020 occupancy (82.6%), followed non-CCRC assisted living (79.3%), memory care (77.7%) and nursing care (75.5%).

The difference in 3Q 2020 occupancy between CCRCs and non-CCRCs was the highest for the memory care segment (8.5 percentage points), followed by the independent living care segment (7.8 percentage points), the assisted living care segment (6.7 percentage points) and the nursing care segment (3.5 percentage points).

Occupancy declined, year-over-year, for each of the care segments. However, CCRCs had lower declines in occupancy than non-CCRCs Among CCRCs, independent living care segment occupancy declined the least (-2.2 percentage points), followed by memory care (-4.5 percentage points), assisted living (-5.5 percentage points), and the nursing care segment   (-9.7 percentage points). Among non-CCRCs, independent living and memory care segment occupancy declined the least (-5.6 and -5.7 percentage points, respectively), followed by assisted living (-6.1 percentage points), and the nursing care segment (-10.4 percentage points).

Higher Annual, Same Store Asking Rent Growth at CCRCs

CCRC same store year-over-year asking rent growth in the third quarter of 2020 was 2.5%, down from the time series high of 4.7% reached in the first quarter of 2019, but higher than the time series low of 2.1% at the end of 2010, beginning of 2012, and the end of 2013. Year-over-year asking rent growth did not vary significantly across the CCRC care segments unlike the non-CCRC care segments; the variation was only 20 basis points for CCRCs but 210 basis points for non-CCRCs. Among CCRCs, the highest year-over-year asking rent growth was 2.1% in the independent living segment; among non-CCRCs it was highest in the nursing care segment (2.1%). The lowest year-over-year asking rent growth was noted for CCRCs in the assisted living care segment (1.9%); in non-CCRCs it was noted for the independent living care segment (0.0%), followed by the memory care segment (0.6%).

Significantly Weaker Inventory Growth at CCRCs

Non-CCRCs had significantly higher rates of inventory growth (year-over-year change in inventory) by segment, than CCRCs. The highest rate of inventory growth was reported for non-CCRCs in the memory care and independent living care segments (4.3% and 4.0%); the lowest was reported for both CCRCs and non-CCRCs in the nursing care segment (0.1% and -0.4%, respectively).

Regional Occupancy Differences are Highest in the Mid-Atlantic, Northeast, and Pacific The current occupancy rates for CCRCs and non-CCRCs by region are shown in the table below. Overall, CCRC occupancy was stronger than non-CCRC occupancy by 8.9 percentage points. Seniors housing and care communities in the Mid-Atlantic, Northeast, and Pacific regions, which were more significantly impacted earlier in the pandemic than other regions, currently have the strongest CCRC occupancy rates ranging from 89.2% to 88.0%. The weakest CCRC (and non-CCRC) occupancy is in the Southwest at 80.9% and 71.5%, respectively—a 9.4 percentage point difference.

ccrcchart4

Look for future blog posts from NIC to delve deep into the performance of CCRCs. For further information on NIC, its reports, data, and analytics available to providers, please visit the NIC website at www.nic.org.

To learn more about NIC MAP® Data Service, and the latest metro-level data available to support your organization, schedule a meeting with a product expert today.


Schedule a Meeting