A frank discussion on what works and where we’re headed now.
Operators are the best source of practical insights into the pandemic. They understand the realities and challenges of a disease outbreak that impacts vulnerable elders.
To provide a discussion forum, NIC held a virtual (by email) roundtable with four operators from different size companies around the country to ask them about their experiences to date.
Participants included: Ken Segarnick, chief corporate officer, Brandywine Living, in the Northeast; Marilynn Duker, CEO, Brightview Senior Living, in the East; Kris Engskov, president, Aegis Living, in the West; and Sarabeth Hanson, president and CEO, Harbor Retirement Associates (HRA), in the Midwest, South and East.
Some common themes emerged: communicate, support staff, and show the wider community why seniors housing is a safe place for loved ones.
What follows is an edited version of their remarks.
Q: What has been the biggest operational challenge during the crisis?
Segarnick: There are, of course, many. One that we have found to be especially challenging is the insidious nature of the virus given how it can be silently spread by asymptomatic carriers.
Duker: The biggest challenge for us has been the lack of available testing, particularly for asymptomatic associates and residents. This no doubt contributed to the spread of the virus in ways that would not have occurred had testing been readily available.
Engskov: We’re in Seattle where the virus first took off in February. People’s safety has been 50% of the challenge and that’s number one. The other half is keeping them healthy and well. People cannot stay behind closed doors all day. And that’s the challenge we face now.
Hanson: The most difficult thing has been the necessity to disrupt our residents’ lives by ceasing communal dining, life enrichment activities and visitation. It’s forced our teams to be very innovative and to put in a great deal of extra effort to ensure that our residents have remained engaged and mentally, physically and spiritually stimulated.
Q: Any silver linings?
Segarnick: History says there’s a silver lining to everything, but I’m not sure we have visibility on that right now. For epicenter markets like the ones where Brandywine operates in the Northeast, we’re still in the middle of combat conditions. Still, even now, it’s evident that quality operators around the country have taken extraordinary action and innovative approaches to contain and mitigate the spread of the virus and have not hesitated to communicate and share their best-practices and experiences with each other.
Duker: A silver lining for us has been the acceleration of innovation and technology. Our talent acquisition team became deeply involved in frontline recruiting during the pandemic to take the workload off the communities. That has led to a much deeper understanding of how we can better support our communities.
Engskov: The pandemic has given us an opportunity to prove to our families why they made the decision to move a loved one here in the first place. We designed this business to keep people safe and healthy and improve their wellness. We have strengthened our capabilities around clinical care and shown families that there is no safer place for their mom or dad than here.
Hanson: Obviously, improved infection control protocols have proven to reduce all communicable illnesses, but the true silver lining is that we are seeing the cohesive culture, mission and core values of HRA really shine through. Daily Zoom meetings are bringing the field and the operational support team together even more than in pre-COVID days.
Q: Can you give an example of a positive operational change?
Segarnick: So many of our residents have embraced technology like Zoom as a means of keeping in contact with their families and have even connected with extended family members they have not seen in a long time. We were surprised at first by how well the residents adapted to the technology. From both a social and healthcare perspective, the pace in which technology has increased its utility in our environment is phenomenal. We will continue to see wider use of technology in many aspects of our community operations.
Duker: Because of the rapidly changing nature of dealing with the pandemic, we began communicating regular updates to families and residents early in the crisis. We have gotten great feedback from families and residents that this is helpful at assuaging worry and unease. We also issue a daily COVID bulletin to our home office and communities every morning at 7 a.m. The bulletin includes links on our intranet to new protocols around cleaning, dining, activities, associate screenings and best practices. The executive directors review each day’s bulletin at morning stand-up meetings with their team, so everyone starts the day on the same page.
Engskov: We made a decision from the beginning that we would be 110% transparent with families, residents and staff. We communicate with families about every other day unless we have a case in the community then we communicate every day. That has made a big difference in helping our families understand what was happening—both good and bad news. We have seen the benefit of being over communicative in a crisis.
Hanson: This pandemic has shown us how helpful increased communication can be. Daily calls from our executive directors to the families with updates, calls to capital partners daily on our new processes and enhanced standards, and our increased use of video technology to connect with families, prospective residents, and referral sources are all enhancements which we will continue to utilize.
Q: Do you anticipate making any operational change permanent?
Segarnick: One of the things we struggled with is how to reduce the risk of exposure for our team members outside of the workplace. This was necessary to mitigate the threat of silent spreading by those carrying the virus without knowing it. One measure we instituted is “Choose Brandywine,” a requirement that team members commit to Brandywine as the exclusive healthcare setting in which they work during the COVID-19 crisis. Put simply, we can’t solve what’s happening in any other building and we can’t fix what we don’t know. While it’s hard to see beyond the pandemic at this point, this is an operational change we’re considering for the future.
Duker: The ways in which we use technology are highly likely to be permanent. These include wide adoption of telehealth, FaceTime and Skype, Microsoft Teams for meetings, and the use of our in-house TV channel for programming and classes. We also accelerated the planned implementation of a new business intelligence software program. We track a whole new set of metrics and the program enabled us to stay on top of all the important measures.
Engskov: We gave our team, within strict protocols, some creative ability to go out and make people happy and saw great results. We’ve had hallways concerts and hallway exercise programs. We launched Aegis Live, a talk show we filmed every two days and broadcast to residents.
Hanson: We will absolutely continue our infection control protocols and our enhanced communications.
Q: How is staff recruitment going?
Segarnick: Coming into this fight with a stable and quality workforce on the ground has made a significant difference. That said, the availability, quality and cost of labor will continue to be a challenge for our entire industry. We ramped up recruitment in anticipation of team members either becoming a victim of the virus or unable to work because they were affected in other ways, particularly in our markets where the virus has been rampant. The new troops have provided us with added reinforcement, bench strength and versatility to respond to conditions existing both within the community and the immediate area.
Duker: We urged all our communities to staff up at the beginning of the pandemic and turned attention to frontline recruiting because we knew our community teams were already stretched. We’ve had great success, hiring over 400 new associates over a 6-week period. That’s an increase of 35-40% over the same time period pre-pandemic and most were from outside the industry.
Engskov: Hiring great people is always hard. In California and Washington where lots of people have been laid off, we have been actively recruiting. There are a lot of people joining senior living who have done different things. They’ll see how they like it. But we are encouraged.
Hanson: At the outset of the pandemic, our corporate director of talent acquisition anticipated the need for additional manpower and immediately launched a campaign to recruit talent from the hospitality industry. This industry which was, obviously, hit very hard by closures, has provided a ready pool of talent from which we have been able to source additional associates to fill vacancies and to enhance our staffing as cooks, servers, housekeeping personnel, maintenance associates and concierges.
Q: How has staff training changed?
Segarnick: This is beyond any flu season we’ve ever seen. So, in addition to the costs of personal protective equipment (PPE), we’ve had to intensively train the staff on its use and the importance of continued compliance at all times. This will become a permanent part of our training paradigm.
Duker: With the exception of the “must have” regulatory training, there is certainly more “on the job” training than in the past and the jobs, in many cases, have been different than what they were before the pandemic (e.g. delivering meals to apartments as opposed to serving a restaurant-style meal in our dining room). We recognize that as the communities begin to open again that we will likely need to go back and do a second round of training as we evolve to a new set of operating protocols.
Engskov: We’ve made a big pivot to focus on the things that are most urgent. Staff must follow protocols with PPE and infection control. We are working on a more customized curriculum for coronavirus focused on how to keep people engaged and identify mental health issues especially with memory care residents when there are restrictions to work around. Training will be different.
Hanson: Obviously, there’s a huge need for training, particularly with recruitment from outside our industry. Our team has worked tirelessly to implement a virtual training system to allow our associates to learn not only the normal functions of their roles, but also the enhanced measures and standards that we have put in place since the beginning of the pandemic. Our teams created videos illustrating the enhanced standards and proper procedures for prevention and the care of COVID residents, sanitization, handwashing, and donning, doffing and care of PPE.
Q: What have you learned from this experience?
Segarnick: The power of transparency. We’re amazed at how our residents, families and team members appreciated our transparent communications with them, even when the numbers were difficult to look at.
Duker: Our experience during the pandemic has reinforced that our focus on culture and on selection and retention of people who are a great fit with that culture must remain paramount.
Engskov: You need to care as much or more about the team as the residents. Our staff people have the same fears all of us have. They are taking care of residents and going home and taking care of their families. A big way to keep residents safe is to keep staff safe and supported. The right PPE is super basic to keep the staff and their families safe.
Hanson: We have always known that communication is key, but it has been more evident with COVID. Regular prayer, devotional, and fellowship sessions offered company-wide, daily zoom meetings sharing new standards, best practices, and good news were all very helpful to our teams during a stressful time. Our enhanced, proactive communications with our residents’ families and our stakeholders was met with such appreciation, that it will continue to be a cornerstone of our operations moving forward.
Q: What concerns do you have for your company or for the industry in terms of the long-term impact of the COVID-19 crisis?
Segarnick: We’re the invisible industry. Assisted living communities are not nursing homes, though the media has fueled misperceptions by conflating these very different types of environments. Because assisted living has been overlooked in its distinct role in the healthcare ecosystem, we have not yet been included in the federal relief programs that have been extended to other healthcare providers. We provide essential care services to the population that has been most affected by COVID-19. We are exhausting enormous resources in sourcing and procuring PPE, maintaining adequate staffing, obtaining and providing testing, and protecting our vulnerable residents during this crisis. Funding and support should follow the need.
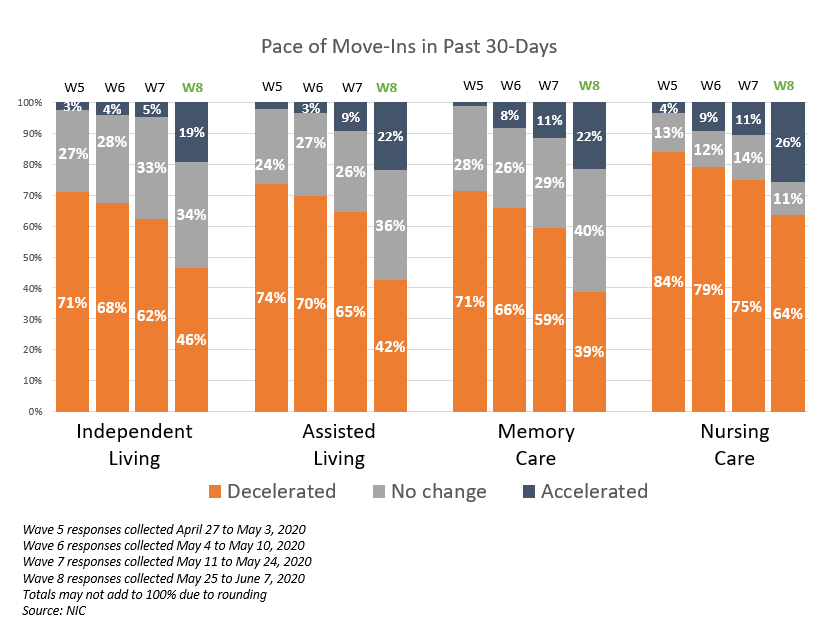
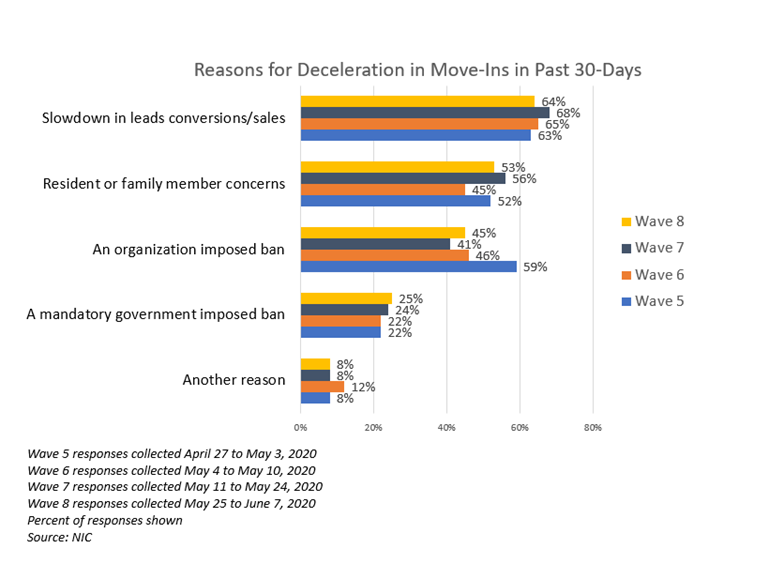
Duker: The industry has a significant need for assistance with access to and funding the cost of widespread, frequent testing. Unfortunately, most of the assistance to date from the federal and state governments has been for nursing homes. The cost of doing the frequency of testing necessary to keep the virus out of seniors housing communities is prohibitive. Without the ability to conduct frequent testing, the value proposition from a resident’s perspective, will be affected due to the continuation of social distancing and other steps that will be necessary to reduce the risk of transmission. This could conceivably slow move-ins and add expenses which would result in downward pressure on operating margins.
Engskov: People desperately want to get back to the way it was, and it is not going to happen for a long time because we are caring for very vulnerable people. We will need to manage expectations of families, caregivers and vendors. We need to remind people why our environments are safe. There are great operators out there adding in extra levels of protection. I want people to look at our communities and say those are the safest places you can be while also living your life.
Hanson: One of our large concerns moving forward is how we safely resume some of the operational pieces that we have changed or ceased altogether. Having visitors in our communities, resuming communal dining in our upscale restaurants, reopening our bars and salon parlors, and resuming group life enrichment are all challenges on which we are thoughtfully strategizing now. Some of these things will require us to, once again, be creative and innovative in devising solutions. There will be costs associated with these things, such as increased staffing, rapid testing, and an increased stock of PPE supplies.
Q: How are you planning to address that issue for your own company?
Segarnick: We need to get people to see us for who we are. We offer both a social and safe place to live for older adults. Healthcare is inextricably bound up in everything we do. We need to do a better job at communicating the role we play in protecting and improving the lives of seniors.
Duker: We have developed a national relationship with a lab to provide us with testing capacity, but the ability to get assistance with funding the cost will be a factor in how frequently we can test.
Engskov: We are introducing a number of innovations. Training and benefits for staff, infection and environmental controls, and outside expertise to help us stay smart.
Hanson: We have begun our plans to thoughtfully begin reopening some of our dining venues, on a limited basis, following stringent sanitation processes and social-distancing protocols. We have initiated testing in communities for associates and residents, and are attempting to source rapid testing equipment
Q: Any other thoughts?
Segarnick: Be ready for a second wave; ready, but not overwhelmed. We’ll get through this, one step at a time. We’re fortunate to have the opportunity to do what we do.
Engskov: We’re really proud of our team. Staffers have risen to the occasion. This is a remarkable career opportunity for someone who wants to get into a growth industry where there is a real mission and great development opportunities.
Hanson: The threat of COVID remains constant but the protocols established have worked to keep the infection rate below 1% for our residents and associates. We created a “Pledge of Love” for HRA which, by signing, our associates commit to following the stringent protocols we have in place both at work and at home in order to ensure that our residents are as safe and cared for as we can possibly make them. This was an initiative we rolled out to the entire company. As the president and CEO, I led the way by being the first to sign.
{{cta(‘05843e86-7aea-4b9a-9eb8-25a86f116f95’)}}
