You could say Joe Jedlowski’s (image left) career as a successful senior housing developer and operator really began when he was a 15-year-old working in the kitchen of a skilled nursing facility. Raised by his paternal grandmother in New Jersey, he grew up watching her work at senior housing properties and eventually followed in her footsteps trying his hand at various industry positions.
Jedlowski was a CNA and administrator at a skilled facility, and later head of operations for one of the largest senior housing providers. Fourteen years ago, he joined as the President of Milestone Retirement Communities, which began with six small properties primarily in the Pacific Northwest and ultimately transformed into a 100-asset powerhouse operating in 22 states.
His wide-ranging, hands-on experience has helped Jedlowski bring balance to the organizations he founded two-and-a-half years ago, Distinctive Living and Distinctive Living Development. “Because I have been in these roles before, I know where to push, and can recognize where to pull back,” he says. “I don’t have unrealistic expectations, but I also don’t accept status quo.”
“I don’t have unrealistic expectations, but I also don’t accept status quo.”
Since its inception, Distinctive has been in growth mode. In addition to the 27 assets currently under ownership, 21 more properties are under development. Most of the company’s portfolio is along the Eastern seaboard, from Florida up to Connecticut. The team is also in the process of acquiring operations of 13 other properties.
Having grown up in tandem with the evolving industry, Jedlowski has gained invaluable insights about the business. More importantly, he developed a passion for the work, and dedication to fellow employees and the residents they serve.
I sat down with Joe to discuss what gives Distinctive an edge, how he approaches growth amid such an uncertain market, and how past experiences inform his work in the senior care space today.
Zuccari: What’s driving Distinctive Living in today’s tumultuous development environment?
Jedlowski: We are in growth mode, but from my perspective, it has to be very thoughtful, structured, and well-informed. We’re also very focused on our own book of business and growing internally. At a high level, we’re opportunistic. It has to be the right deal with the right metrics and the right rents.
There’s no denying that the industry is going through a hard time right now. And I think it’s going to get harder over the next six months. But now that the Feds have hinted at stabilizing rates, I feel like we’ll have some pressure relieved in Q1 going into Q2 next year.
“We are in growth mode, but from my perspective, it has to be very thoughtful, structured, and well-informed.”
Zuccari: Due to these tough times, many companies are holding off on development. How do you balance your growth ambitions with the current state of the market?
Jedlowski: Our approach is based on a few factors that have worked well for us in the past.
The first is site selection. We spend time looking at sites mostly in mid-to-high barrier to entry markets. Secondly, we do significant market intelligence on these locations to determine how we can maximize our revenue structure. Throughout the process, we’re asking pointed questions: What’s the right amenity space for these assets? What’s the right cost expense load?
From a development standpoint, we kill around 95 to 98 percent of all of the deals we look at because they’re either too expensive, not enough demand, or we can’t get a good rate. If the market and the demand are good, we then proceed to our capital partners and begin the equity raise into the projects.
We’re fortunate to have solid equity partners who have deep pockets, but also don’t have senior housing investor fatigue. Many of them are newer to the space and like the market demographics they see—future demand, absorption, and lack of supply.
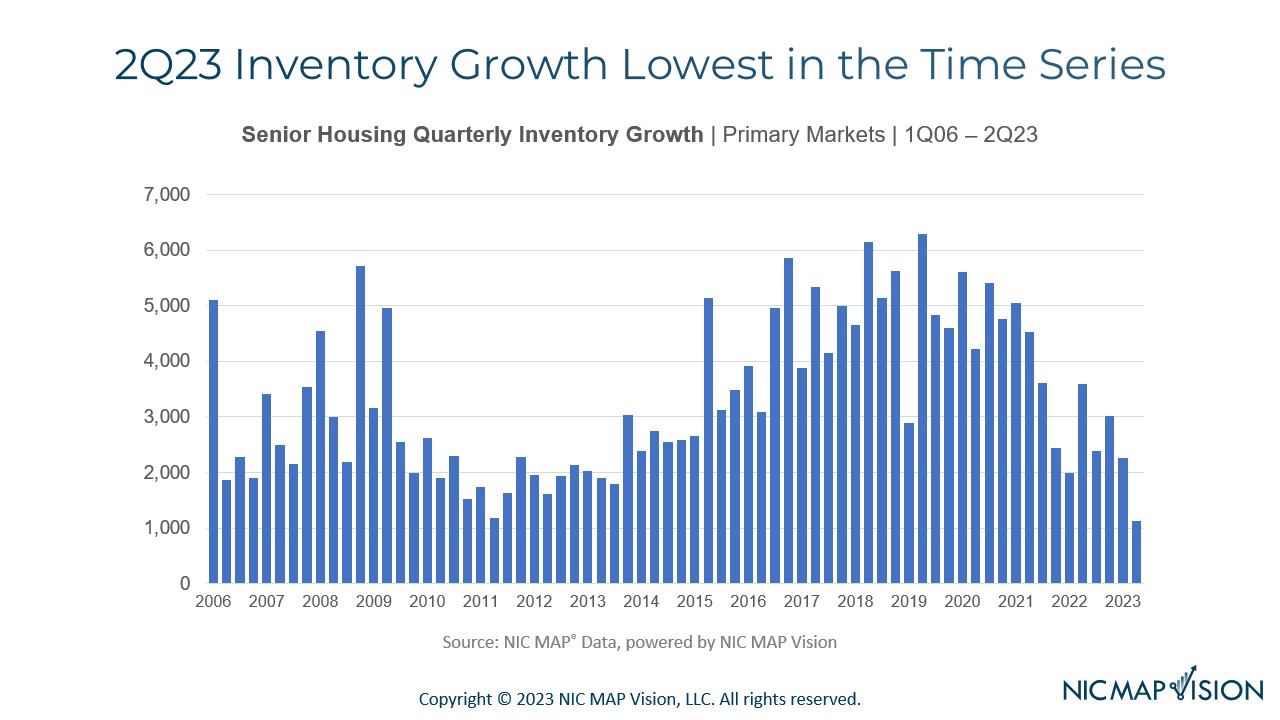
Our investor base and team as a whole feel very strongly that, since there has been limited development in the past four years because of COVID, when our projects come out in the next 24 to 36 months, there’s going to be significantly less new supply.
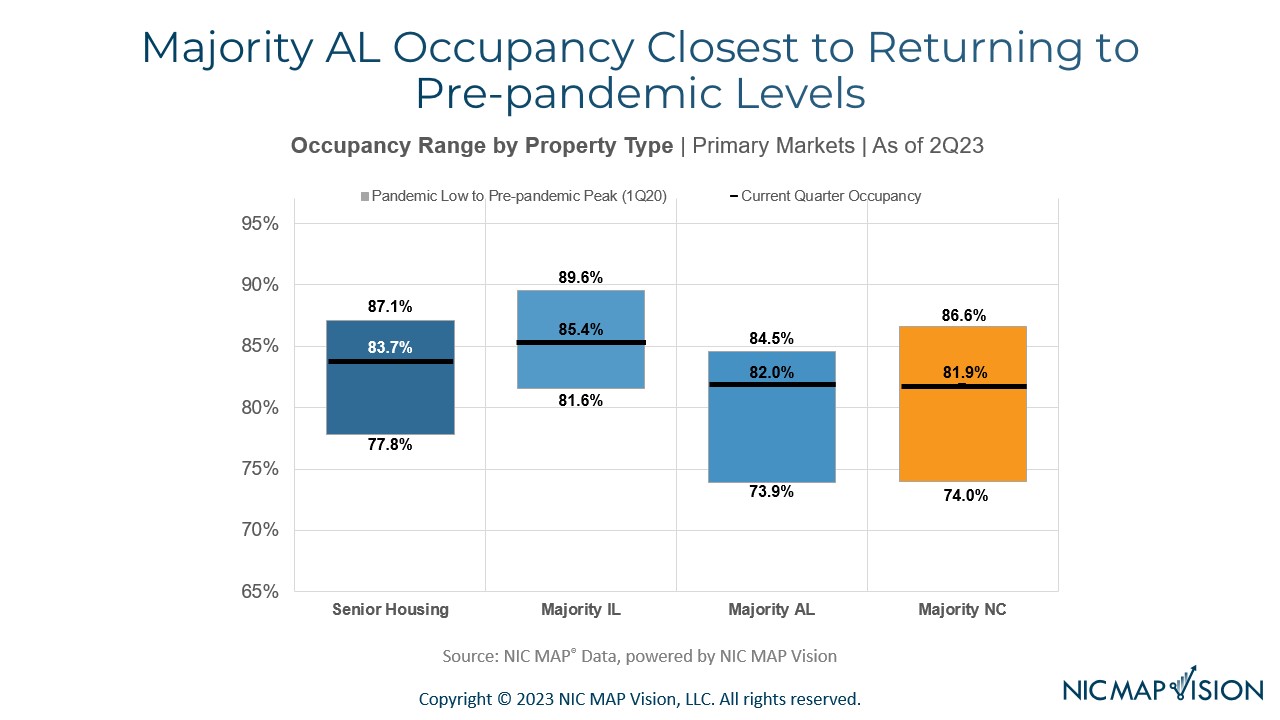
Occupancy continues to climb in all of the U.S. primary market areas, which has made us more willing to take on extra cost burden as we look to the future. Ultimately, we feel like right now is the time to put the pedal to the metal because of future demand projections and lack of supply to meet them.
“Ultimately, we feel like right now is the time to put the pedal to the metal because of future demand projections and lack of supply to meet them.”
Zuccari: Is there a ceiling to your growth ambitions?
Jedlowski: This is a question I’ve been asked a lot. For me, if all Distinctive could do well is what we’re doing today, then I would be content. We certainly want to grow, but whatever project we take on, whether it’s development or operations, we want to be able to adequately live up to the expectations of our capital and also meet the expectations of the employees and residents that we serve.
The bottom line is if we can’t do it well then we’re not going to do it. If we have confidence we can do it, we’re going to go in and hit it head on.
Zuccari: How are you innovating in the senior care development vertical?
Jedlowski: The first part of the development phase is looking at a piece of dirt and determining what you can build on it. Distinctive strategically partners with an architectural firm based in D.C. Part of their company is located in Vietnam, which gives us a competitive advantage and saves us a lot of money. We can have a project brought to us by noon today, and by tomorrow, have a very rough concept plan of what this project will look like. We’re able to present site details including how many stories and units to build, if there are setbacks on the land, and how the property will fit spatially on the land—all while staying compliant with city requirements.
These site plans can often take up to two weeks, so speeding up the architectural programming phase of the design and development has given us an invaluable edge over other developers in the space.
Zuccari: Is there anything else that sets you apart from traditional senior care development companies?
Jedlowski: We have a fully vertical platform. Distinctive has an interest in a general contracting company, which allows us to control construction costs. It also gives us insight into what’s going on behind the curtain as it relates to supply and labor costs. Additionally, we’re able to put up completion guarantees.
Our operating and development platform really work in unison. We can holistically look at a project and decide if we can push rates, or figure out how to value engineer an asset. I think that whole complement of our interdisciplinary team members is critical to our success.
“I think that whole complement of our interdisciplinary team members is critical to our success.”
Zuccari: When you’re considering taking over an asset, what’s the first thing you do?
Jedlowski: Our first point of business is pulling market demographics and data. Sometimes we’ll get a call from owners saying they’re unhappy with their management. When we go and look at the market and realize that it’s not the operator that’s the problem. Oftentimes, we come to the conclusion that we likely won’t be able to do any better than the company currently in place.
The second part, and probably the most important, is team evaluations. Like any business, employees dictate the success of a building. If the team isn’t strong, we’ll go and put the right team in place.
Lastly, we drop in all of Distinctive’s signature programs: memory care, Distinctive dining, and others. The combination of those elements—good team, good market, good programs—typically yields us good results.
” The combination of those elements—good team, good market, good programs—typically yields us good results.”
Zuccari: How has your past experience informed how you do business today?
Jedlowski: In this business, we tend to prioritize the residents above all else. For me, my partners, and our organization, we lean very much into our employees because we believe that will trickle down to the residents.
I remember one boss, a director of nursing at a facility, who treated me like absolute trash. I often think about how that made me feel and remind my senior leadership—you get from our team members what you put in.
That’s a huge part of our company culture. The folks who probably work the most, make the least, and have the greatest obligations at home, are the people foundational to our business. Regardless of all the bells and whistles and the snazzy names we put on programs, taking care of people is the core of what we do.
“The folks who probably work the most, make the least, and have the greatest obligations at home, are the people foundational to our business.”
___
