Time-Series Data and Pre-Pandemic Benchmarks: The NIC Investment Guide

In tune with NIC’s mission of educating the market on the opportunities and challenges of investing in seniors housing and care properties, The NIC Investment Guide: Investing in Seniors Housing & Care Properties, serves as a primer on the senior housing and care sector.

In tune with NIC’s mission of educating the market on the opportunities and challenges of investing in seniors housing and care properties, The NIC Investment Guide: Investing in Seniors Housing & Care Properties, serves as a primer on the senior housing and care sector.

The Sixth Edition of the NIC Investment Guide, based on year-end 2019 time-series data, serves as a benchmark to the sector prior to the COVID-19 pandemic. Takeaways from this edition include:

  • The investment-grade senior housing and care market is estimated to have a nationwide inventory of nearly 24,500 properties inclusive of more than 3.0 million units, and its overall market value is estimated at $474.5 billion.
  • The market value estimate is based on an average $210,000 price per unit for senior housing properties and an average $81,000 price per bed for nursing care properties.
  • The largest owner category of senior housing and care properties are private for-profit entities with ownership of 55.4% ($2 billion) of units in senior housing properties and 67.2% ($78.6 billion) of units in nursing care properties. Publicly traded REITs own 11.6% ($41.4 billion) of units in senior housing properties and 6.5% ($7.5 billion) of units in nursing care properties.

The technical chapters of the NIC Investment Guide include a detailed description of each senior housing and care community type. The community type descriptions incorporate resident profiles, supply data, industry operating structures, operating economics, and current trends. The Guide also discusses underwriting criteria, the development and construction of new properties and the acquisition of existing properties, debt and equity sources, and valuations, returns, and loan performance.

As in prior editions, the Sixth Edition features a chapter on Emerging Trends and Observations written by members of NIC’s Future Leaders Council (FLC). Drawing upon the acumen of industry participants to make observations and discuss emerging trends for which contemporaneous, empirical data may not be available, the topics put forth are forward-looking considering operating strategies, capital markets, joint venture preferences, labor shortages and the rising costs of labor, fragmented senior housing regulation, provider partnerships, and the growing market share for Managed Care, just to name a few. It also includes detailed appendices related to alternative housing and services, active adult communities, factors affecting demand, trends in technology, risks and mitigating factors, and the collaboration between housing and healthcare.

The large and growing middle market is also addressed. In 2019, The Forgotten Middle: Middle Market Seniors Housing Study was completed with results of the analysis published as a manuscript in Health Affairs. The study defined the middle-income cohort as people aged 75 and older who do not qualify for government assistance for senior housing—such as Medicaid—but are not wealthy enough to afford traditional private pay, market-rate senior housing for a meaningful amount of time. As shown below, the study determined that 54% of middle-income seniors will not have sufficient financial resources to cover projected average annual costs of approximately $60,000 for assisted living rent and other out-of-pocket medical costs by 2029.


Additionally, through NIC’s strategic alliance with Real Capital Analytics, the NIC Investment Guide provides pricing and volume metrics on closed sales transactions of senior housing and care properties throughout the U.S. for the prior 10 years, and cap rates by property type. When comparing valuations among different senior housing property types, the use of cap rates and price per unit (PPU) are common measures. As shown by the exhibit below, development cap rates have historically been 250-500 basis points higher than those of existing properties, although recently those spreads have narrowed.


A reflection of NIC’s mission to provide data, analytics, and connections, all of which advance the access and choice of seniors housing and care for America’s elders, examples such as these and more are widely accessible through NIC’s Investment Guide. The Executive Summary of the NIC Investment Guide is available free of charge as a PDF download from nic.org. The full NIC Investment Guide, Sixth Edition is available both as a PDF file priced at $50 per copy and as a print publication priced at $100 per copy. Both can be found at store.nic.org.


Relatively Weak September Employment Report:  Jobs Up by 195,000

The Labor Department reported that nonfarm payrolls rose by a disappointing 195,000 in September 2021. The consensus had been for an increase of 500,000. This was a deceleration from August when jobs grew by an upwardly revised 366,000 (originally reported as 235,000) and from July when jobs increased by 1,091,000, up from 1,053,000 as originally reported.

The Labor Department reported that nonfarm payrolls rose by a disappointing 195,000 in September 2021. The consensus had been for an increase of 500,000. This was a deceleration from August when jobs grew by an upwardly revised 366,000 (originally reported as 235,000) and from July when jobs increased by 1,091,000, up from 1,053,000 as originally reported. The three-month moving average of nonfarm payrolls was 550,000 as of September, versus 806,000 in August and 889,000 in July, still strong but signaling some slowing in momentum. Nonfarm payrolls remain down by 5.0 million from pre-pandemic levels of February 2020.  

Interestingly, the labor force contracted by 183,000 and was 3 million less than at its pre-pandemic level. Many had speculated that the labor force would increase since enhanced unemployment benefits had largely expired and schools largely reopened.


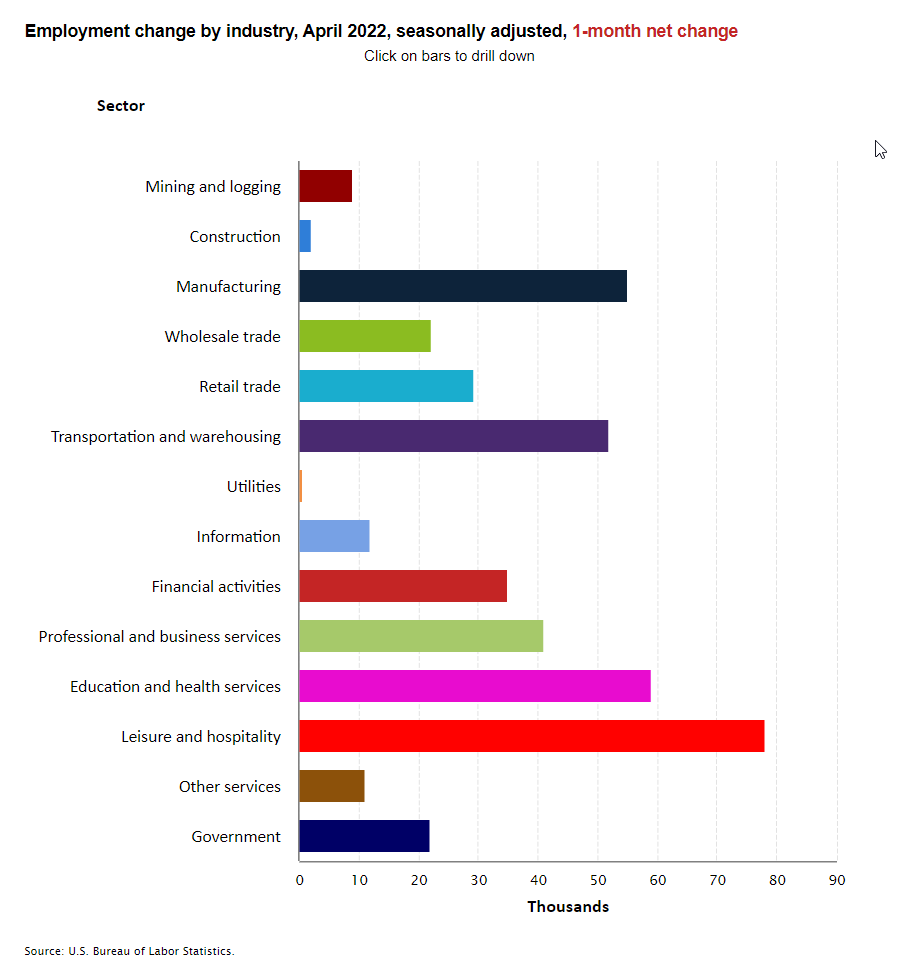
The data show that the U.S. recovery from the pandemic continues, but at a slower pace. The COVID-10 Delta variant may be weighing on the economy as evidenced by the limited growth in the high-contact leisure and hospitality sectors (up only by 74,000) which had been expanding rapidly prior to August. Businesses may be holding off hiring and workers may be holding off taking jobs amid heightened fear of the Delta variant. 

Today’s report is important as the Federal Reserve wants to see “substantial progress” in the economy before it shifts monetary policy and begins “tapering” when it will purchase fewer long-term securities for its balance sheet and before it starts to shift toward a higher interest rate regime. While disappointing from what the markets had anticipated, the report is likely strong enough that the Fed will begin tapering its asset purchases next month. That said, the growing evidence of upward pressure on wages suggests that the Fed will remain concerned about inflationary pressures. 

Indeed, average hourly earnings for all employees on private nonfarm payrolls rose by $0.19 in September to $30.85, a gain of 4.6% from a year earlier and up from a revised 4.3% in August. September marked the fifth consecutive month of increases. The data suggests that rising demand for labor associated with the recovery from the pandemic is putting upward pressure on wages. The large annual increase also occurred despite the return of lower-wage leisure and hospitality workers which theoretically should be depressing the overall increase. That said, the Labor Department warns that the pandemic has affected the ability to fully interpret the wage data due to the wide swings in employment trends.


Job levels continued to contract for nursing and residential care facilities which fell by 38,000. Overall employment in health care is down by 524,000 since February 2020, with nursing and residential care facilities accounting for about 80% of that loss.

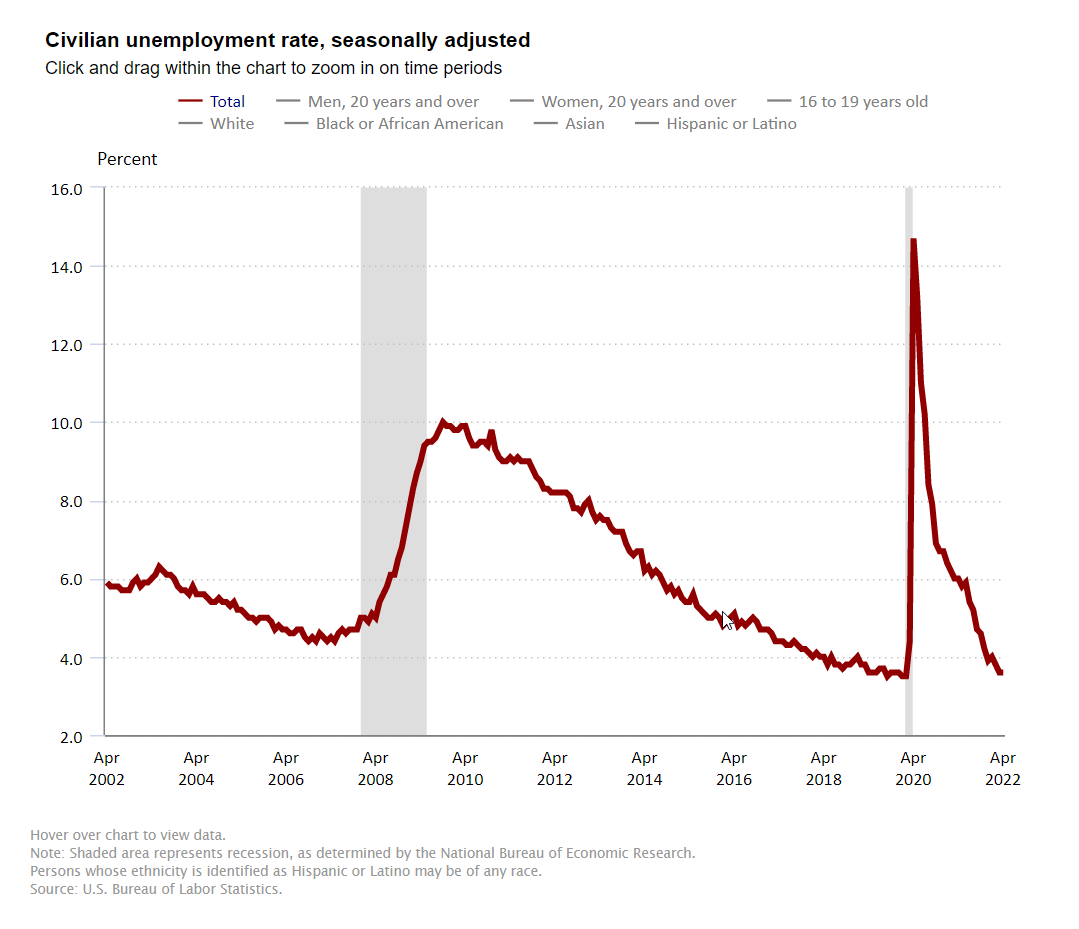
Separately and from a different survey, the Labor Department reported that the unemployment rate fell by 0.4 percentage point to 4.8% in September and the number of unemployed persons fell to 7.7million, still higher than the 5.7 million persons prior to the pandemic. The jobless rate is now 1.3 percentage points above the pre-pandemic level of 3.5% seen in February 2020, but well below the 14.7% peak seen in April 2020. The underemployment rate or the U-6 jobless rate was 8.5% down from 8.8% in August 2021. This figure includes those who have quit looking for a job because they are discouraged about their prospects and people working part-time but desiring a full work week.

Skilled Nursing Occupancy Continued Slow Recovery in July

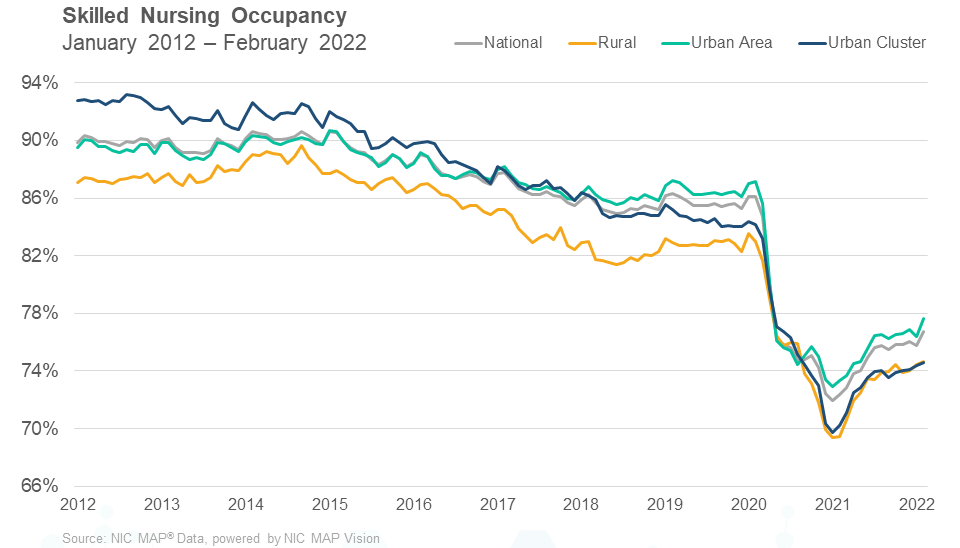
NIC MAP® data released its latest Skilled Nursing Monthly Report on September 30, 2021, which includes key monthly data points from January 2012 through July 2021.


Reimbursement differential between Medicare fee-for-service and managed Medicare hits record.


NIC MAP® data, powered by NIC MAP Vision, released its latest Skilled Nursing Monthly Report on September 30, 2021, which includes key monthly data points from January 2012 through July 2021.

Here are some key takeaways from the report.

Skilled nursing property occupancy increased for the sixth consecutive month in July, gaining 58 basis points from June to end July at 75.0%. Occupancy is now up 355 basis points from the pandemic low of 71.4% reached in January. Despite the improvement, occupancy remains very low compared to the pre-pandemic February 2020 level of 85.5%. More recently, the Delta variant has challenged the occupancy recovery as some areas of the country have experienced hospital capacity constraints which in turn have caused elective surgeries to slow. This can have a direct impact on skilled nursing occupancy as referrals from hospitals may decline as a result. Staffing is also a challenge as some operators are unable to hire an appropriate number of staff to accept admissions for new patients into their properties.

SNF occupancy July 2021

Medicare revenue per patient day (RPPD) held steady from June to end July 2021 at $560. However, Medicare RPPD has declined throughout the year dropping 1.5% from January 2021 when COVID-19 cases were elevated at skilled nursing properties. During the pandemic there has been support from the federal government to increase Medicare fee-for-service reimbursements for COVID-19-positive patients requiring isolation. RPPD has now declined and one possible reason is lower property-level case counts. Medicare RPPD has decreased 2.2% from the pandemic high set back in June 2020. Medicare revenue mix increased from June to July. However, it has also been trending down since January 2021, dropping 431 basis points to 20.3%. This suggests that, in addition to lower RPPD, utilization of the 3-Day Rule waiver declined as COVID-19 cases declined relative to the month of January. The 3-Day Rule waiver was implemented by Centers for Medicare and Medicaid Services (CMS) to eliminate the need to transfer positive COVID-19 patients back to the hospital to qualify for a Medicare paid skilled nursing stay.

Following four months of decline, Medicaid revenue per patient day (RPPD) increased from June to end July at $241. Medicaid RPPD was trending downward after hitting a high of $243 in February this year. However, this latest monthly data shows a 3.7% increase from February 2020, prior to the pandemic. Medicaid reimbursement has increased more than usual as many states embraced measures to increase reimbursement related to COVID-19. On the other hand, covering the cost of care for Medicaid patients is still a major concern as reimbursement does not cover the cost in many states. In addition, nursing home wage growth is elevated, as is inflation measured by the Consumer Price Index, and staffing shortages are a significant challenge in many areas of the country. Expectations are that wage growth will remain elevated as staffing challenges persist with turnover and competition for labor from other industries.

Managed Medicare revenue per patient day (RPPD) declined further in July and was down 4.5% from a year ago. The continued monthly decline in managed Medicare revenue per patient day creates additional challenges to skilled nursing operators during the COVID-19 crisis as the reimbursement differential between Medicare fee-for-service and managed Medicare has accelerated during the pandemic. Medicare fee-for-service RPPD ended July 2021 at $560 and managed Medicare ended at $447, representing a time-series record differential of $113.  Pre-pandemic, in February of 2020, the differential was $95.  As Medicare Advantage enrollment now represent 46% of all eligible Medicare beneficiaries, and continues to grow, operators must find ways to adjust such as opening their own insurance plans.

SNF RPPD July 2021

To get more trends from the latest data you can download the Skilled Nursing Monthly Report here. There is no charge for this report.

The report provides aggregate data at the national level from a sampling of skilled nursing operators with multiple properties in the United States. NIC continues to grow its database of participating operators in order to provide data at localized levels in the future. Operators who are interested in participating can complete a participation form at https://www.nic.org/skilled-nursing-data-initiative. NIC and NIC MAP Vision maintain strict confidentiality of all data received.


Interested in learning more about NIC MAP data? To learn more about NIC MAP data, powered by NIC MAP Vision, and about accessing the data featured in this article, schedule a meeting with a product expert today.

Looking Forward and Looking Up: A Conversation with LTC’s Wendy Simpson

For the first time in a while, Wendy Simpson, chairman and CEO at LTC Properties, is looking forward to the next earnings call for the publicly traded REIT. Business is looking up at the Westlake Village, California-based company after a difficult year for the entire industry.

For the first time in a while, Wendy Simpson, chairman and CEO at LTC Properties, is looking forward to the next earnings call for the publicly traded REIT. Business is looking up at the Westlake Village, California-based company after a difficult year for the entire industry.

NIC Chief Economist Beth Mace recently talked with Simpson about LTC’s approach to financing solutions. They discussed the last 18 months and the outlook for LTC and the industry. Overall, Simpson is optimistic. Why? She credits LTC’s employees, its board of directors, the stability of its balance sheet, and the dedicated people throughout the industry who stepped forward in a crisis.

Here’s more detail in a recap of their conversation:

Mace: LTC Properties is a real estate investment trust (REIT) investing in seniors housing and health care primarily through sale-leasebacks, mortgage financing, joint ventures, construction financing and structured finance solutions including preferred equity, bridge, and mezzanine lending. How does your structure as a REIT better position you than other lenders and private equity groups in financing solutions for both senior housing and skilled nursing properties?Simpson Wendy 3239

Simpson: We strive to provide options for our operators. The best way to understand our approach is to contrast it with other sources. Unlike private equity, LTC is a long-term holder. We’re not looking to recycle an asset in 5-7 years. Our rates are generally lower than private equity because we’re not looking for a residual value. We strive to have assets that appreciate, but the value appreciation is greatly enhanced by the performance of the operator. Contrasting LTC to banks, they are often the first to step back when a sector has problems. And we haven’t stepped back from these asset classes. We keep a solid balance sheet so we can offer structured financing solutions. When banks step back, we sometimes can salvage the deal. We have different goals than other possible financing sources. We hope to be the solution for the operators’ financial goals and structures.

Mace: Many REITS have embraced RIDEA structures (an acronym that stands for the REIT Investment Diversification and Empowerment ACT) where REITs can participate in the actual net operating income if there is an involved third-party manager. Most of your structures at LTC are triple net leases (NNN) with annual rent payments and escalations, and joint ventures (JVs) as opposed to RIDEA structures. Why is this?

Simpson: Early on, when RIDEA emerged as a structure, we ran some acquisition options, and we couldn’t understand why investors in the RIDEA structure were paying real estate multiples for the operations. We did understand that the upside was the ability to invest in an underperforming asset and benefit from the addition of a quality operator. To do that, an investor needs people who understand operations and we didn’t have anyone with operations experience. You really have to delve into operations to be part of the RIDEA structure. We would have had to hire people and carry that overhead to make a big investment in RIDEA. Historically, we haven’t been big enough to have a concentration in this new line of business. Also, I’m a firm believer that operators have more incentive if the bottom line is all theirs. We just don’t see the same incentive in the RIDEA structure for the operators.

Mace: The industry has been challenged during the pandemic, but throughout the crisis, it has stepped up to the myriad problems ranging from securing PPE in the early days of March 2020 to the recognition of the importance of socialization even during periods of physical distancing to the distribution of vaccines in December 2020. Unlike some industries, it never closed. It has shown itself to be responsive, flexible adaptable, and proactive.   What types of challenges have you incurred during these turbulent times?   And what creative financing solutions has LTC implemented for your clients and prospective clients?

Simpson: From our point of view our challenge was revenue insecurity. Operators had massive issues. We established connections with operators to find PPE and share the status of government relief programs. We were a cheerleader to provide rent abatements and other deferrals for operators. We also stepped up financially to support our operators by providing a level of rent abatement in 2021 which gave them additional cash to help defray the costs of the impact of the pandemic. We’re pleased with the opportunities we see in shorter-term financing and bridge lending as we ramp up revenues from the properties with new operators. Inside LTC, we were able to work virtually, so we didn’t miss a step on auditing or quarterly reports.

Mace: LTC Properties was established in 1992. You joined the company in 2000 and took the helm as CEO and President in 2007 and were appointed Chair of the Board in 2013. How has LTC changed in those years? What are you most proud of?

Simpson: We began in 1992 as a skilled nursing home lender providing mortgages for skilled nursing homes. Our founder Andre Dimitriadis said it was like shooting fish in a barrel. No one else was lending in the space except banks and they were lenders, not investors. More healthcare REITS were established in the mid-1990s and LTC began buying, developing, and investing in assisted living assets and operators. For most of our history, we’ve been equity investors in skilled nursing and private pay senior housing. In 2022, we’re looking to invest more dollars in financing vehicles as a nod to our early history. What I’m most proud of is our employees and board. We have a meeting coming up and I have a chart showing employment history. I lead the chart since I had a 1995 board position and became an employee in 2000. Our average tenure is 10 years, pulled down only by some great recent hires. Financially, I’m most proud of our balance sheet. While it’s nail biting right now, we have maintained and not cut our dividends during this period of stress in the industry. Even though we have remained small, we’re stable and secure. We’re open about the challenges we’ve had with our operators, but we’ve worked with them and kept our shareholders and market analysts informed.

Mace: As the leader at LTC, what does the future look like?

Simpson: For the first time in six quarters, I’m somewhat looking forward to our earnings call in October. I think we have a pretty bright 2022. It’s nice to be looking up and 2022 seems like a much better year.

Mace: Are you optimistic for the recovery of the sector in the remaining part of 2021 and into 2022?

Simpson: I‘m optimistic. It’s amazing what people did during the ravages of the pandemic. How can you not be optimistic when you are working with people like that?

Mace: What are some of the challenges that need to be overcome? Anything keep you up at night?

Simpson: Another variant or wave of COVID-19 would slow the recovery. If there was another variant the industry has the protocols to stem the amount of damage that might be done. I don’t think it would be like 2020, but it would slow the recovery. I also worry about our operators being able to get staff. It’s universal. I haven’t talked to an operator yet that doesn’t have trouble getting and retaining staff. And it’s not about money. Many places are paying $15 an hour. I hope with the expiration of the extra $300 in unemployment and the opening of school that people will come back to work. There’s still some insecurity relative to childcare because parents worry that schools might close.

Mace: Anything else you’d like our readership to know about LTC?

Simpson: LTC does well bonding with operators. We really want to get to know them and be part of their culture. We’re not just providing structured finance products. Our operators see us as partners that they can work with. That’s important for people to know. We want to be part of the financing solution.

Medicare Claims Data Provides Granular Insights into Market Demand:  A Conversation with NIC MAP Vision CEO Arick Morton

NIC MAP Vision offers insights on local acuity rates based on Medicare claims data. This invaluable information provides a window into the healthcare needs of seniors in a particular market.

Accurate data informs better decisions. Owners, operators, and developers want to know what factors drive their business to help it grow.

Now, NIC MAP Vision offers insights on local acuity rates based on Medicare claims data. This invaluable information provides a window into the healthcare needs of seniors in a particular market.

NIC Chief Economist Beth Mace recently talked with NIC MAP Vision CEO Arick Morton. They discussed how Medicare data can help stakeholders make better decisions about which markets are under or overserved. Here is a recap of their conversation.

Mace: Senior living operators looking to enter a market area often simply track age and income eligibility with public census data. This assumes little to no variation in the needs along the care continuum. Is this a sufficient approach? Why or why not?

Morton: The answer to that is a resounding ‘No.’ A rise in acuity and the associated need is really the core driver of the senior housing business these days. ARM (002)Qualified residents are those who need the product and have the ability to pay. Historically, age has been used a proxy for need. But we couldn’t quantify the need. So, we restricted the analysis to ages 75-plus to determine national averages of need rates among that group in a specific market. The major challenge to that approach is that Seattle and Biloxi, for example, have very different acuity rates in their senior population. We’ve analyzed the variations by market and the differences are considerable. The differences also vary within communities. When considering whether to build a new community, not being able to calibrate the need metric at the local level really frustrates the ability to get an accurate picture. That was one of the things we set out to solve. And now, with Medicare claims data, we can see the rate of healthcare needs that allows us to calibrate utilization down to the market level.

Mace: Can you give an example of how NIC MAP Vision is used to assess opportunities in each MSA?

Morton: The Alzheimer’s Association, for example, publishes dementia incidence data on an annual basis. Developers may use those national numbers, which on average are accurate. But the dementia level in any given local market could massively vary. Now we have the data on the local level. Instead of assuming we have an average of a 10% incidence of dementia out of 100 individuals in the 75-plus age group, we know that there are actually 18 individuals with dementia because we have the Medicare claims data. That data is housed in Medicare’s Chronic Conditions Data Warehouse. It includes all claims in a master beneficiary file with basic demographic information about the beneficiary. Their diagnoses can be searched, say, for dementia.

Mace: Medicare claims data can be used to show a market area’s quality measures, such as readmission rate or dollars spent per point of the HCC medical codes. How can operators use this data to tailor services to potential residents?

Morton: There are a lot of benchmarking capabilities that can be leveraged. At the simplest level, operators can look at what the cognitively impaired population looks like. What are the other healthcare characteristics of that population? What does the assisted living and memory care continuum look like? A market may have a lot of healthier individuals with early-stage memory loss. So, does a bridge program make sense? What doesn’t a market have? How do we bend the cost curve? What kinds of clinical programs are in place? That’s where a lot of the chronic conditions data comes into use. Based on the population level incidence, operators can scale up a number of programs to manage conditions such as diabetes, hypertension and fall risks.

Mace: The value of senior living is created by a combination of both the real estate and the services offered within a community. When faced with an aging property or community, how can claims data be used to differentiate it from the competition, despite not having the newest building?

Morton: It depends on the community’s operating segment. In the caregiving segment, as the building ages, it’s difficult to differentiate the community on real estate. So, the focus is on differentiating the care. The data can help inform and guide that strategy. A clear example is an older property that has developed a really thoughtful bridge program between assisted living and memory care that allows a resident in the early stage of memory loss who might otherwise be in a secured unit to have a better quality of life. The resident has more services, but it saves the family a bit of money compared to the secured unit. As we continue to move towards a more integrated experience between senior housing and healthcare, we will see more health management specialization. Risk bearing entities will start to manage conditions, sending individuals to places that best match the clinical profile. That will become more and more of a force in the market. The focus there is on the outcome rather than the real estate. The challenge is to figure out what those programs should be and get them up and running, and well established. The older building may not be as pretty, but the family knows their loved one is getting a higher level of care tailored to the individual’s needs. The claims data can be an incredible asset in that regard.

Mace: Medicare data has historically been lacking in timeliness. Is this beginning to change? How so?

Morton: One of Medicare’s top priorities has been to increase the timeliness of the data. We’re seeing that in a couple ways. A number of different information fields on the claims form are being released more quickly. There will always be a lag because claims data needs a seasoning process. The window is left open for 90 days for the beneficiary to submit data. The file is not complete until the 90-day mark. Claims are about 70-80% percent complete in 30 days. Medicare Advantage files previously had delays of 4-5 years, but that gap is rapidly closing. And we’re seeing that across the board. We’ll never have real time data, but we can expect to live in a world with about only a couple months lag time.

Mace: Is there, or will there be, an ability to see trended Medicare claims data within a time-series format for markets? How would clients access this and how would they use it?

Morton: Yes, that data is available, and the ability to access time-series data is on our roadmap. That will be very important in several years. The COVID-19 outbreak scrambled existing trends and produced new ones. The Medicare claims data base is about as real time as it gets in terms of the acuity of seniors and where they’re headed. So, being able to use that to get real time insights into relocation trends will be incredibly valuable. It will be especially useful given the short-term dislocations and reset that COVID-19 has caused.

Mace: In terms of Medicare claims data, what is the latest update that clients should be aware of?

Morton: It is now possible to access Medicare claims data in a way that allows us to begin to build a full picture of how seniors are accessing healthcare, paving the way for us to finally understand how seniors housing and the healthcare system are serving seniors together.

Mace: Can we obtain the number of current and future estimated Medicare discharges originating in a zip code or collection of zip codes/census tracts (PMA)?

Morton: Yes, we have the beneficiary’s location. We can see the full utilization pattern of those beneficiaries, such as what hospital they go to and what physicians they visit. We can see the whole picture.

Mace: Are clients able to find the percentage of Medicare discharges to skilled nursing facilities in the PMA and the state?

Morton: Yes.

Mace: Can we obtain average Medicare length of stay?

Morton: Yes, we can obtain length of stay and most utilization metrics. The data varies a bit by provider whether for skilled nursing vs. in-patient hospital stays. But the information is highly available.

Mace: Can we obtain the number of hospital discharges to particular skilled nursing facilities by DRG code?

Morton: Yes

Mace: Can we get the trend of discharges over time?

Morton: Yes.

Mace: Can we also get the same for home health and see a comparison?  For example, for a certain DRG, can we see what share home health has taken from a skilled nursing facility?

Morton: Yes.

Mace: What else would be useful for our readers to know?

Morton: We are about two weeks out from being able to include NIC MAP® rate and occupancy custom metrics in Market Insight analyses. This new functionality will empower clients to get NIC MAP property advisor report-esque data at scale for the first time. In lieu of running individual property advisory reports (PARs), clients with access to both NIC MAP Local and Market Insight will be empowered to run up to 4,000 reports at once on PMAs of varying shapes and sizes. The one thing I’d like to emphasize is how useful it is to look at the variability of chronic conditions across market areas and metros. It’s data that a lot of the market studies don’t consider, but it’s something stakeholders should know to make informed decisions.


Interested in learning more about NIC MAP data? To learn more about NIC MAP data, powered by NIC MAP Vision, and about accessing the data featured in this article, schedule a meeting with a product expert today.