Executive Survey Insights | Wave 23: February 22 to March 7, 2021

NIC’s Executive Survey of operators in seniors housing and skilled nursing is designed to deliver transparency into market fundamentals in the seniors housing and care space as market conditions continue to change.

“The pandemic has necessitated many changes in the way seniors housing and care operators do business. In the NIC Executive Survey Insights Wave 23 results, respondents were asked to list one of the things that their organization plans to keep doing, stop doing, bring back and further develop. In addition to maintaining COVID-19 and infection mitigation protocols, organizations will continue leveraging virtual technologies for a variety of uses including digital marketing campaigns, entertainment, remote visits, and some activities. With 80% of survey respondents’ residents fully vaccinated on average, seniors housing and care operators are looking forward to bringing back communal dining, group activities, resident/employee gatherings, and discontinuing visitation restrictions, meal delivery, pandemic staff benefits, and frequent COVID-19 testing.

–Lana Peck, Senior Principal, NIC

NIC’s Executive Survey of operators in seniors housing and skilled nursing is designed to deliver transparency into market fundamentals in the seniors housing and care space as market conditions continue to change. This Wave 23 survey includes responses collected February 22 to March 7, 2021 from owners and executives of 69 small, medium, and large seniors housing and skilled nursing operators from across the nation, representing hundreds of buildings and thousands of units across respondents’ portfolios of properties.

Detailed reports for each “wave” of the survey and a PDF of the report charts can be found on the NIC COVID-19 Resource Center webpage under Executive Survey Insights. Additionally, the full range of time series data for each wave of the survey by care segment for move-ins, move-outs and occupancy rate changes can be found here.

Wave 23 Summary of Insights and Findings

  • According to Wave 23 seniors housing and care survey respondents, roughly 80% of residents and 55% of staff of their respective properties—including all care segments across their portfolios—have been fully vaccinated. From late January to the present, resident uptake of the vaccine increased as the vaccine reached more and more residents. Staff uptake of the vaccine has, however, appeared to have leveled off. Prior surveys (Waves 21 and 22) explored the many ways organizations have promoted COVID-19 vaccinations to residents and staff. The positive impact of the vaccine on decreasing new cases and deaths relative to the total U.S. population is clearly illustrated in data compiled in NIC’s Skilled Nursing COVID-19 Tracker.

  • A slim majority of organizations surveyed in Wave 23 indicate they will probably not or definitely not make the COVID-19 vaccine mandatory for staff (55%); however, one-quarter probably will or definitely will (25%). The share of organizations considering making the vaccine mandatory for staff has increased since Wave 22 (11%).

  • Many operators have been eagerly anticipating a boost in occupancy due to the COVID-19 vaccine availability. One-third of organizations responding to the Wave 23 survey noted an increase in prospect interest specifically related to the vaccine—up from 25% in Wave 21. Nearly two-thirds of survey respondents (62%) expect their organizations’ occupancy rates to recover to pre-pandemic levels sometime in 2022.
  • For the third successive survey wave, the shares of organizations reporting acceleration in the pace of move-ins is higher than those organizations reporting deceleration for each of the care segments. Furthermore, organizations reporting deceleration in the pace of move-ins has shrunk to time series lows in the memory care, assisted living and nursing care segments.

  • Looking specifically at the independent living care segment—considered a “choice-based” move-in because of the type of and lower level of care services delivered compared to assisted living, memory care and nursing care (considered needs-based move-ins)—it is interesting to note that the pace of move-ins has also trended positively since the Wave 20 survey, reflecting operator experiences in December 2020. In Wave 23, 40% organizations with independent living units in their portfolios of properties noted acceleration in the pace of move-ins—the highest in the survey since Waves 9 through 14—surveyed late-June through the end of October.

  • Although increased resident demand was cited by three-quarters of respondents (77%) as a reason for acceleration in move-ins in the past 30-days, only about one in ten respondents in the Wave 23 survey reported that their organizations had a backlog of residents waiting to move in (11%)—lower than at any other time since the question was first asked in late July. Possible reasons may include the previously mentioned trend of the pace of move-ins increasing across each of the care segments taking up some of the slack in pent-up demand, residents moving to different levels of care, the lifting of restrictions due to vaccine uptake among residents, and potentially less turnover of inventory in some properties as the pace of move-outs continued to slow in the Wave 23 survey.
  • The share of organizations currently offering rent concessions remains around 50% since W12, surveyed mid- to late-September. Of those organizations with multiple properties, nearly two-thirds (64%) say they are offering rent concessions in more than 50% or all of their properties.
  • The Wave 23 survey data shows a trend in the shares of organizations reporting an increase or no change in occupancy since the prior survey for the assisted living, memory care and nursing care segments. Roughly half of organizations with nursing care beds in their portfolios of properties reported higher occupancy rates from one-month prior in survey Waves 22 and 23.

  • The chart above shows that in Wave 23, 54% of organizations with nursing care beds reported increasing occupancy rates in the past 30-days. As shown in the chart below, the majority of the increases were larger than reported in the Wave 22 survey. (The blue and orange-hued stacked bars correspond to the solid bars in the chart above indicating the degree of change by the saturation of color.) In the Wave 22 survey, 30% of respondents with nursing care beds reported occupancy increases of 0.1 to 3 three percentage points, however, in the Wave 23 survey, one-third (35%) reported occupancy increases of 5 percentage points or more.

  • One-third of respondents—similar to the share of organizations in the Wave 10 survey—expect an increase in their development pipelines going forward (33% and 30%, respectively). It is interesting to note that organizations’ expectations have not changed much since last summer. Among those who expect their development pipelines to increase, reasons such as current and future market demand, and continuation of expansion plans prior to the pandemic, were cited most frequently.
  • In the Wave 23 survey, respondents were asked to list one of the things that their organization plans to keep doing, stop doing, bring back and further develop. Respondents mentioned that their organizations would keep doing and/or further develop COVID-19 infection mitigation, and virtual technologies for entertainment, remote visits, and some activities. Others would keep doing and/or further develop employee engagement programs, and digital and social media marketing campaigns.
  • Respondents are looking forward to bringing back communal dining, group activities and resident/employee gatherings, and discontinuing visitation restrictions, meal delivery, pandemic staff benefits, and COVID-19 isolation of residents, and frequent testing.

Wave 23 Survey Demographics

  • Responses were collected between February 22 and March 7, 2021 from owners and executives of 69 seniors housing and skilled nursing operators from across the nation. Owner/operators with 1 to 10 properties comprise just over one-half of the sample (58%). Operators with 11 to 25 properties make up about one-quarter of the sample (23%), while operators with 26 properties or more make up 19% of the sample.
  • One-half of respondents are exclusively for-profit providers (52%), one-third (33%) are nonprofit providers, and 15% operate both for-profit and nonprofit seniors housing and care organizations.
  • Many respondents in the sample report operating combinations of property types. Across their entire portfolios of properties, 73% of the organizations operate seniors housing properties (IL, AL, MC), 28% operate nursing care properties, and 37% operate CCRCs (aka Life Plan Communities).

Owners and C-suite executives of seniors housing and care properties, we’re asking for your input! By demonstrating transparency, you can help build trust. The survey results and analysis are frequently referenced in media reports on the sector including in McKnight’s publications, Mortgage Professional America Magazine, Senior Housing News, Multi-Housing News, Provider Magazine, and other industry-watching media outlets. The surveys’ findings have also been mentioned in stories by Kaiser Health News, CNN, the Wall Street Journal, and other major news outlets across the U.S.

The Wave 24 survey is available and takes 5 minutes to complete. If you are an owner or C-suite executive of seniors housing and care and have not received an email invitation to take the survey, please click this link or send a message to insight@nic.org to be added to the email distribution list.

NIC wishes to thank survey respondents for their valuable input and continuing support for this effort to bring clarity and transparency into market fundamentals in the seniors housing and care space at a time where trends are continuing to change.

93% of Skilled Nursing Facilities Report No New Cases of COVID-19

In a promising sign for the sector, no new COVID-19 cases were reported in 93% of U.S. skilled nursing facilities for the week ending February 21, according to data available in the NIC Skilled Nursing COVID-19 Tracker

In a promising sign for the sector, no new COVID-19 cases were reported in 93% of U.S. skilled nursing facilities for the week ending February 21, according to data available in the NIC Skilled Nursing COVID-19 Tracker

It’s been a year since the coronavirus pandemic first unfolded in the U.S., disproportionately impacting older Americans. Thanks to increasing vaccination rates, many hospitalizations and fatalities have been, and will be, avoided among the population most susceptible to serious complications from COVID-19.

The most recent CMS data compiled by NIC’s Skilled Nursing COVID-19 Tracker show that 93% of skilled nursing facilities reported no new COVID-19 cases for the week ending February 21, 2021, up 28 percentage points from 65% recorded on December 20. The drop in case counts is coincident with more widespread distribution and administration of the vaccines across skilled nursing facilities.

1-Mar-10-2021-04-23-00-40-PM

The chart below depicts that for the week ending December 20, 2021, 9.8% of skilled nursing facilities reported 10% or more of their residents tested positive for COVID-19, but on February 21, 2021, only 0.2% reported infections of 10%+. The share of skilled nursing facilities reporting new confirmed cases appears to be declining across all infection rate cohorts.

2-3

98% of skilled nursing facilities with less than 50 units reported no new COVID-19 infections for the week ending February 21, 2021, the highest share among all skilled nursing facilities with respect to size. The smallest share of skilled nursing facilities reporting no new COVID-19 infections was among large facilities (150 Units +) at 87%.

3-1

Newly confirmed cases of COVID-19 among skilled nursing residents fell to another pandemic record low during the reporting week, down 94% over the last nine weeks since the launch of the Long-Term Care vaccination program – from 32,588 on December 20, 2020 to 1,903 on February 21, 2021. U.S. weekly infections fell 71% over the span of those same nine weeks.

Per-resident rate of new COVID-19 infections within skilled nursing facilities plummeted to a new low point on February 21 (0.20%). Only 1 in 500 residents tested positive for COVID-19 on February 21 compared to 15 in 500 residents on December 20 (3.03%).

4-1

As shown below, new cases among residents have fallen faster than new cases among staff since the start of vaccine rollout. For the week ending December 20, new COVID-19 cases among skilled nursing residents were 21% higher than among staff. By February 21, newly confirmed cases among residents were 24% lower than among staff for the first time in months. This speaks to the higher vaccination rates among residents.

5-1

As of February 21, 2021, 2.2 million residents living in long term care communities have been fully vaccinated in the Federal Pharmacy Partnership Program, according to the CDC. The average vaccination rate in the U.S has recently picked up to two million per day and will likely continue to increase, suggesting that 100 million Americans who are most vulnerable to the coronavirus will likely be fully vaccinated in the next month or two.

In addition to three approved vaccines to fight the virus, the FDA has recently issued first emergency use authorization for a molecular non-prescription at-home COVID test. This self-administered and over-the-counter technology could help significantly with isolating new cases and mitigating the risk of spread of new variants until vaccines are more widely distributed. CUE Health plans to produce over 100,000 over the counter COVID tests per day by summer 2021, according to its co-founder and chief product officer.

Furthermore, recent lab analysis indicate that the Pfizer-BioNTech Covid-19 vaccine is effective against new variants of the coronavirus. This can only encourage the CDC to ease restrictions on visitation at long term care settings, a long-awaited relief for residents and their loved ones.

Protecting all of America’s seniors and ensuring the safety and wellbeing of our role models should continue to be our priority. The older adult generation include heroes—scientists, doctors, nurses—of yesterday, whose contributions to our society allow us today to continue to carry the torch forward and create a better future for ourselves and generations to follow.

To gain in-depth insights and track the week-over-week change rate for new resident cases and fatalities of COVID-19 within skilled nursing facilities at the state and county levels, visit NIC.org. You can also access the Skilled Nursing COVID-19 Tracker along with a rich trove of analysis and insight on the NIC COVID-19 Resource Center.

NIC is committed to provide timely data, analyses and insights that increase transparency and understanding of the sector, especially in this difficult time of COVID-19. We strongly support all actions and efforts that prioritize distribution of COVID-19 vaccines, testing, and availability of PPE to protect frontline workers and residents.

Skilled Nursing Occupancy Hits Low in December 2020

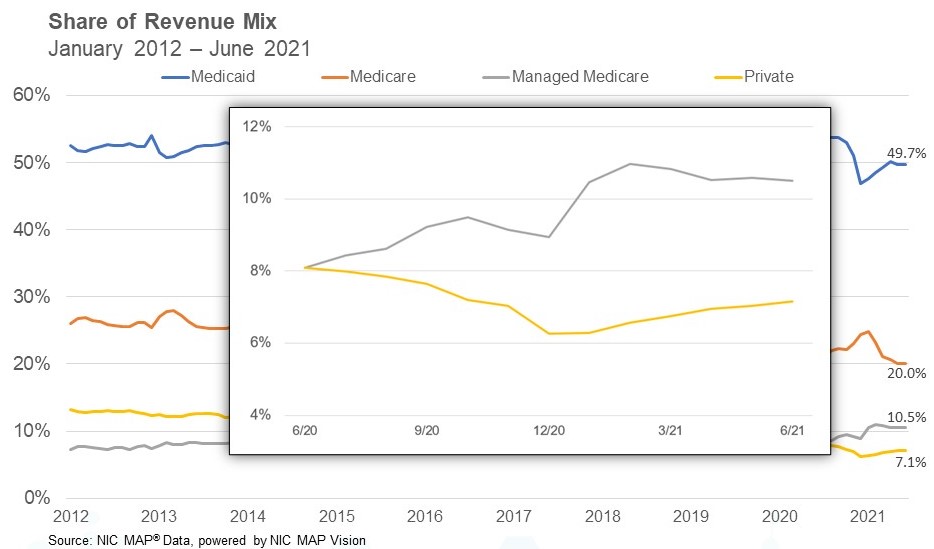
Medicare Revenue Mix Increases to 23.3%

NIC MAP® Data Service released its latest Skilled Nursing Monthly Report on March 4, 2021, which includes key monthly data points from January 2012 through December 2020.

Key takeaways from the report are available below.

Occupancy

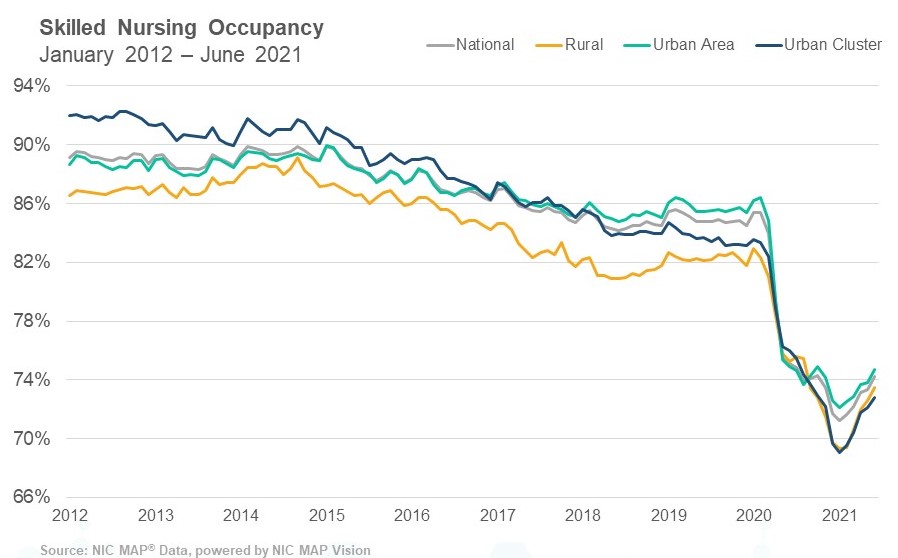
Skilled nursing property occupancy continued to be pressured through year-end 2020, hitting a new low of 71.7% in December. This was down 1.4 percentage points from November (73.1%) and 13.3 percentage points from February 2020 (84.9%), the month before the pandemic started. The pandemic has significantly impacted skilled nursing operations across the country creating challenges for patient census. However, since the vaccine rollout began in December and continues to date, there is an expectation that COVID-19 cases will continue to decline, and occupancy will pick up. The question remains, however, of how quickly this bounce back will occur.

Managed Medicare

Managed Medicare patient day mix increased 41 basis points from November to 6.9% after hitting a 12-month low during the pandemic of 5.4% in May. However, it was down 24 basis points since February (7.1%). The increase since May suggests managed Medicare is playing an increasing role in overall operations, but this is all in the context of a significant drop in occupancy. Managed Medicare admissions are likely significantly below levels prior to the start of the pandemic given the decline in elective surgeries and competition from home health care. In addition, managed Medicare revenue mix was off its 12-month low of 8.0% set back in May. As of December, it was at 8.8% but down 230 basis points since February.

Medicare

Medicare revenue mix continued to increase as 2020 closed, ending at 23.3% in December and up 67 basis points from November. Medicare revenue mix has held up relatively well since the pandemic began in March compared with other payors. It is up 186 basis points since March compared to managed Medicare (down 150 basis points) and private pay (down 254 basis points). As overall occupancy has declined dramatically during the pandemic creating significant pressure on skilled nursing operators, Medicare patient days likely did not decrease as much as they would have given that the Centers for Medicare and Medicaid Services (CMS) waived the 3-Day Rule. The rule waives the requirement for a 3-day inpatient hospital stay prior to a Medicare-covered skilled nursing stay.  

Medicaid

In contrast to the Medicare experience, Medicaid revenue mix hit a new low in December, ending at 43.7%. It has decreased 8.4 percentage points since March when it was 52.2%. This suggests total Medicaid patient days have dramatically decreased since March, due to lower overall admissions and some Medicaid patients who may have converted to Medicare due to the waiver of the 3-Day Rule during this crisis period. Medicaid revenue mix was down 9 percentage points from year-earlier levels.

To get more trends from the latest data you can download the Skilled Nursing Monthly Report here. There is no charge for this report.

The report provides aggregate data at the national level from a sampling of skilled nursing operators with multiple properties in the United States. NIC continues to grow its database of participating operators in order to provide data at localized levels in the future. Operators who are interested in participating can complete a participation form here. NIC maintains strict confidentiality of all data it receives.

4Q2020 NIC MAP Seniors Housing Actual Rates Report Key Takeaways

The NIC MAP® Data Service recently released national monthly data through December 2020 for actual rates and leasing velocity. In this release, NIC also provided data on three metropolitan areas:  Atlanta, Philadelphia, and Phoenix. 

The NIC MAP® Data Service recently released national monthly data through December 2020 for actual rates and leasing velocity. In this release, NIC also provided data on three metropolitan areas:  Atlanta, Philadelphia, and Phoenix.  

Slide1-2

A few key takeaways from the 4Q2020 NIC MAP Seniors Housing Actual Rates Report are listed below. Full access to the reports and other takeaways is available to NIC MAP® Data Service clients.  

  • Average initial rates for residents moving into independent living, assisted living and memory care segments were below average asking rates, with monthly spreads generally largest for memory care. Care segments refer to the levels of care and services provided to a resident living in an assisted living, memory care or independent living unit.
  • The average discount for the memory care segment was the largest of the three care segments in December 2020 and averaged 10.2% below average asking rates. This equates to an average initial rate discount of 1.2 months on an annualized basis, the highest level of discounting for memory care since April 2020.
  • As of December 2020, initial rates for assisted living care units averaged 7.1% ($364) below average asking rates. This equates to an average initial rate discount of 0.9 months on an annualized basis, even with one year earlier.
  • The average annualized discount for independent living segments was 0.8 months in December 2020, more than in December 2019 at 0.6 months.
  • Average in-place rates for residents in assisted living and memory care segments were below average asking rates. The discount was smaller for in-place rates than initial rates compared with asking rates.
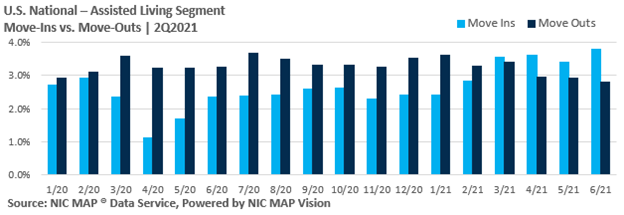
  • The rate of move-outs has exceeded or equaled the rate of move-ins for each of the prior twelve months for both the independent living and assisted living segments, and for five of the last twelve months for the memory care segment as of December 2020. The difference between the pace of move-outs and move-ins was widest in the immediate aftermath of the pandemic start in the March, April, and May period.

The NIC Actual Rates Data Initiative is driven by the need to continually increase transparency in the seniors housing sector and achieve greater parity to data that is available in other real estate asset types. Now, more than ever, in the world of the COVID-19 pandemic, having access to accurate data on the actual monthly rates that a seniors housing resident pays compared to property level asking rates helps the sector achieve this goal.

About the Report

The NIC MAP Seniors Housing Actual Rates Report provides aggregate national data from approximately 300,000 units within more than 2,600 properties across the U.S. operated by 25 to 30 seniors housing providers. The operators included in the current sample tend to be larger, professionally managed, and investment-grade operators as we currently require participating operators to manage 5 or more properties. Note that this monthly time series is comprised of end-of-month data for each respective month.

While these trends are certainly interesting aggregated across the states, actual rates data is even more useful at the metro level. NIC is continuing to work towards reporting more markets.

Interested in Participating?

The Actual Rates Data Initiative is an effort to expand seniors housing data and we are looking for operators who have five or more properties to participate. We have expertise in extracting data from industry leading software systems, such as Yardi, PointClickCare, Alis and MatrixCare, and can facilitate the process for you.

Your organization benefits through:

  • More informed benchmarking, strategic planning, and day-to-day business operations,
  • Increased transparency, aligning with other commercial real estate assets in terms of data availability, and
  • Enhanced investment and efficiency across the sector.

Learn more by visiting nic.org/actual-rates.

Your Blog Post Title Here…