“The June 2023 ESI again asked respondents to identify the share of full-time positions across their organization that are currently open. The responses indicate an improvement in the number of open positions that are impacting communities.
In April 2023, only 5% of organizations reported having between 0% and 5% of full-time positions open. In June 2023, 20% or one-fifth of owners and operators report having the same lowest range of openings across full-time positions. This represents a four-fold increase over the past two months in the number of organizations reporting the lowest range for vacancies in full-time positions.
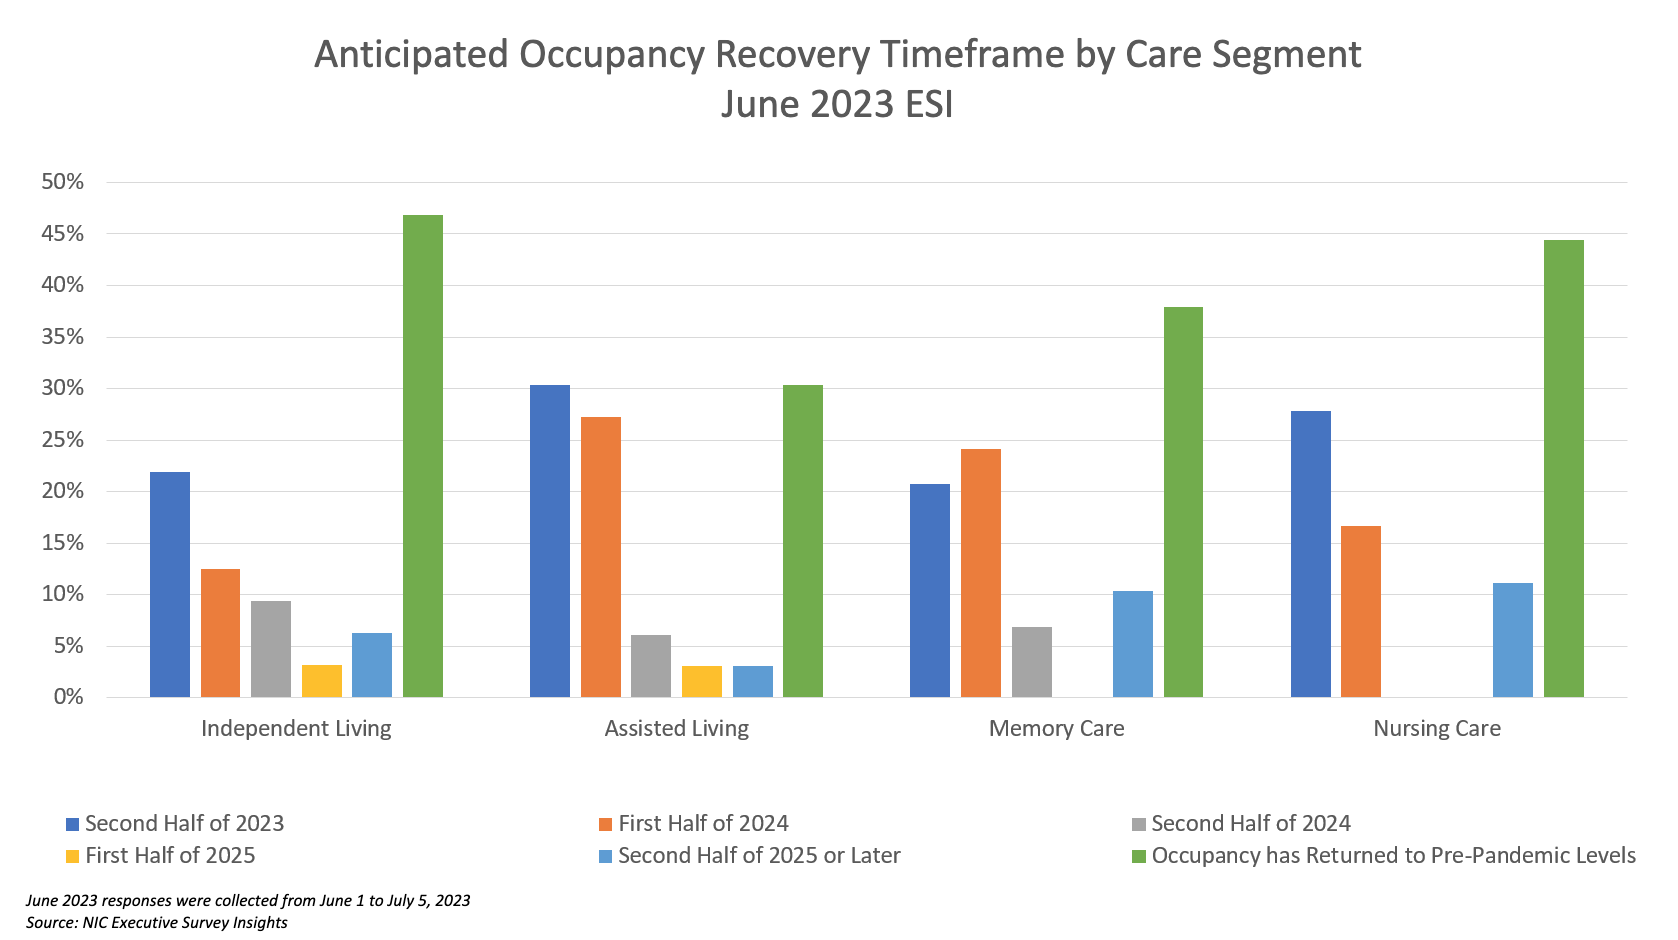
As staffing challenges can limit the number of new residents a community can intake, the anticipated occupancy recovery timeframes of respondent organizations are noteworthy. Almost half of respondents indicate that occupancy in their independent living (47%) and nursing care segments (44%) have returned to pre-pandemic levels, with approximately one-third of their memory care (37%) and assisted living care segments (30%) having returned to pre-pandemic occupancy levels.”
–Ryan Brooks, Senior Principal, NIC
This Executive Survey Insights (ESI) survey includes responses from June 1 to July 5, 2023, from owners and executives of 39 small, medium, and large senior housing and skilled nursing operators across the nation, representing hundreds of buildings and thousands of units across respondents’ portfolios of properties. More detailed reports for each “wave” of the survey and a PDF of the report charts can be found on the NIC COVID-19 Resource Center webpage under Executive Survey Insights.
Questions in the June 2023 ESI focus on the current staffing and labor environment, including the scope of staffing shortages and the driving factors behind them, the share of full-time open positions across respondent organizations, and expectations on when staffing challenges will improve. Responses across a number of these staffing and labor related questions – including whether or not an organization is experiencing a staffing shortage and the current share of full-time, open positions – indicate improvements are being realized. 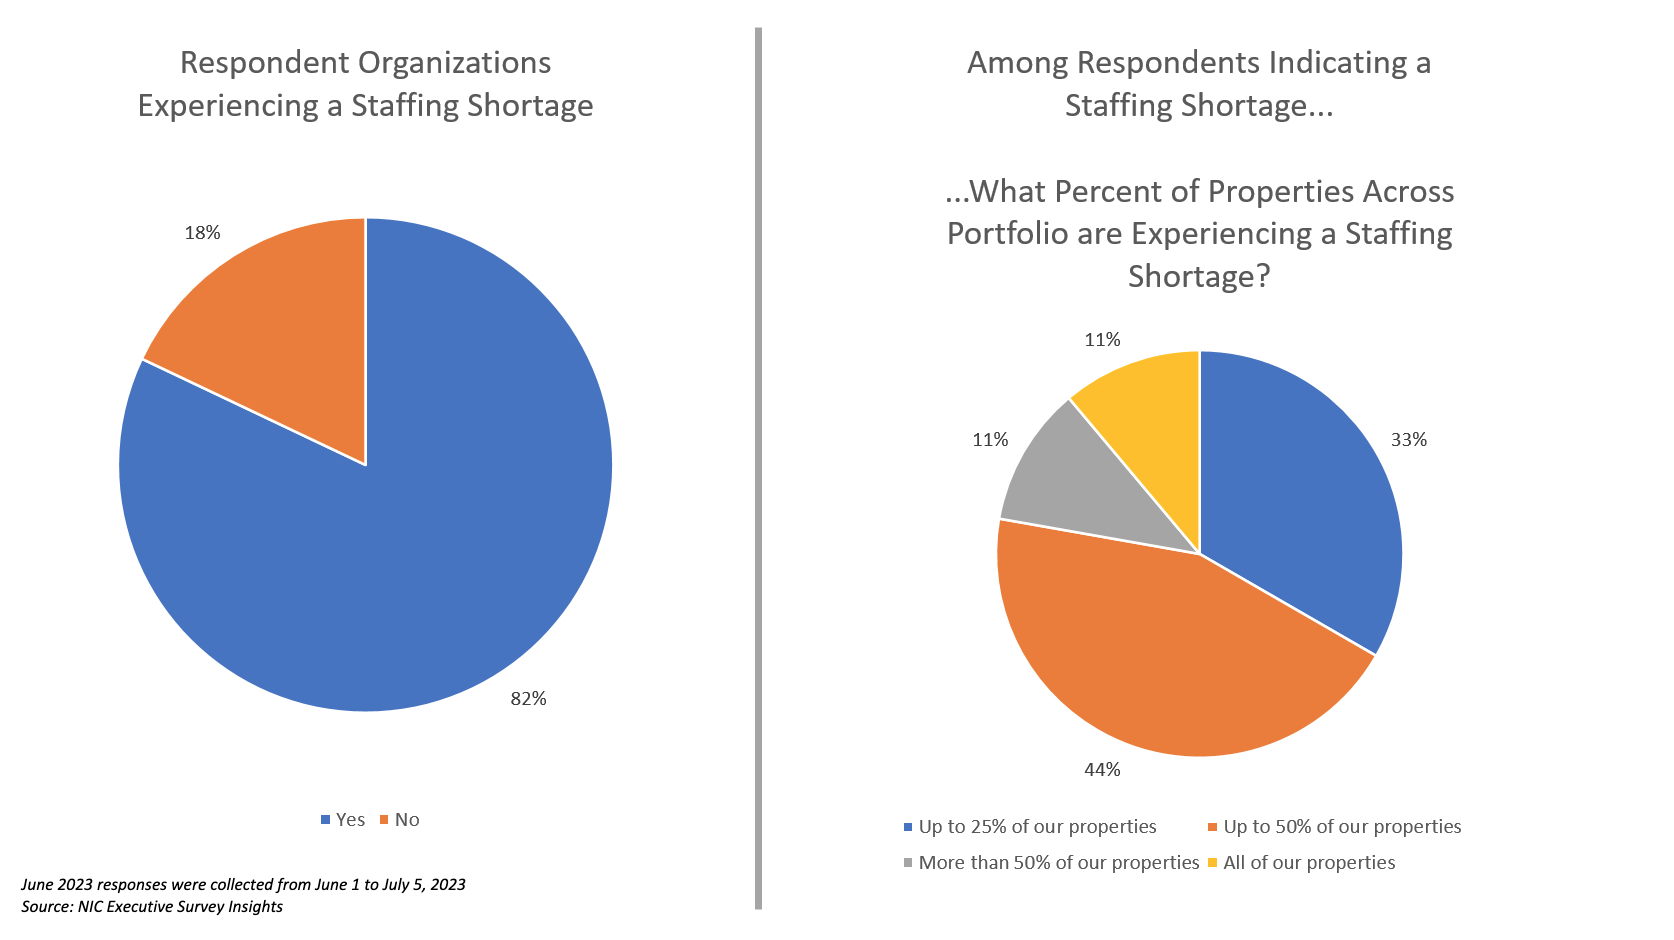
For the surveys of the prior 18 months, between 90% and 99% of organizations consistently reported experiencing a staffing shortage within their organization. In June 2023, four-fifths of organizations (82%) report a staffing shortage at their organization. While this represents a considerable portion of senior housing and care communities undergoing a staffing shortage, seeing improvement in this metric is noteworthy.
Of organizations experiencing a staffing shortage, one-third of respondents (33%) are experiencing the shortage in up to 25% of their properties and two-fifths (44%) are experiencing the shortage in 26% to 50% of their properties. One-tenth of respondents are experiencing a staffing shortage in more than half of their properties and another one-tenth are experiencing a staffing shortage across all of their properties.
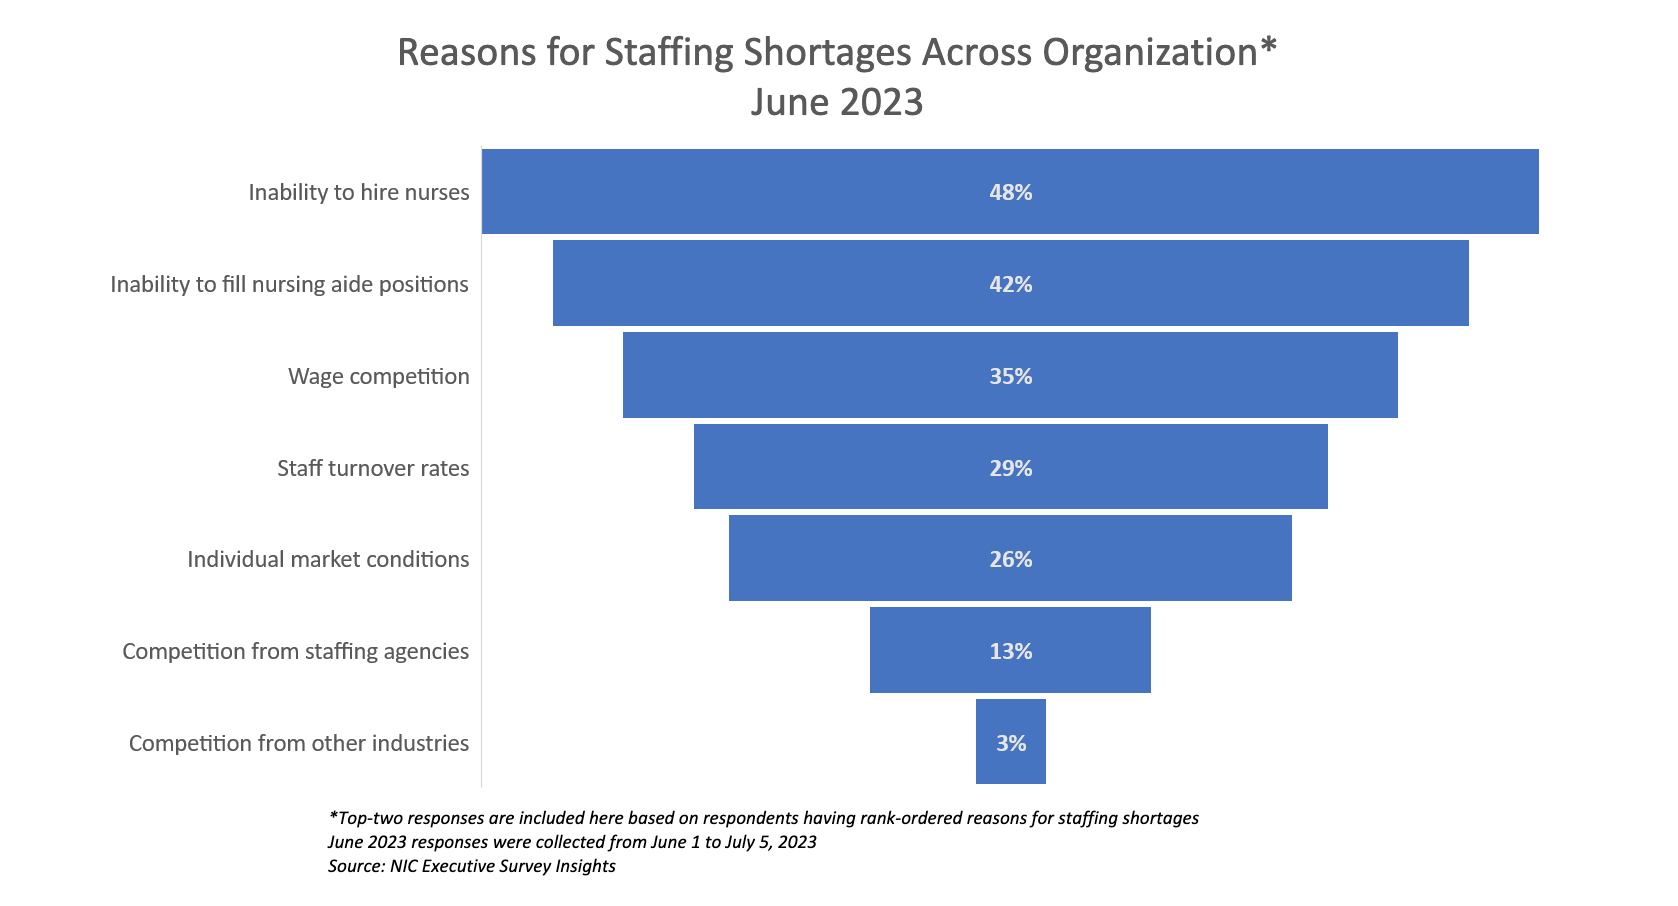
When asked about the two top factors driving the existing staffing shortages, an inability to hire nurses was cited by almost half of respondents (48%), followed by an inability to hire nursing aide positions (42%), wage competition (35%), and staff turnover rates (29%).
The June 2023 ESI again asked respondents to identify the share of full-time positions across their organization that are currently open. Responses indicate there has been improvement in the number of open positions that are impacting communities. In April 2023, only 5% of organizations reported having between 0% and 5% of full-time positions open. In June 2023, 20% or one-fifth of owners and operators report having the same lowest range of openings across full-time positions. This represents a four-fold increase over the past two months in the number of organizations reporting the lowest range for vacancies in full-time positions.
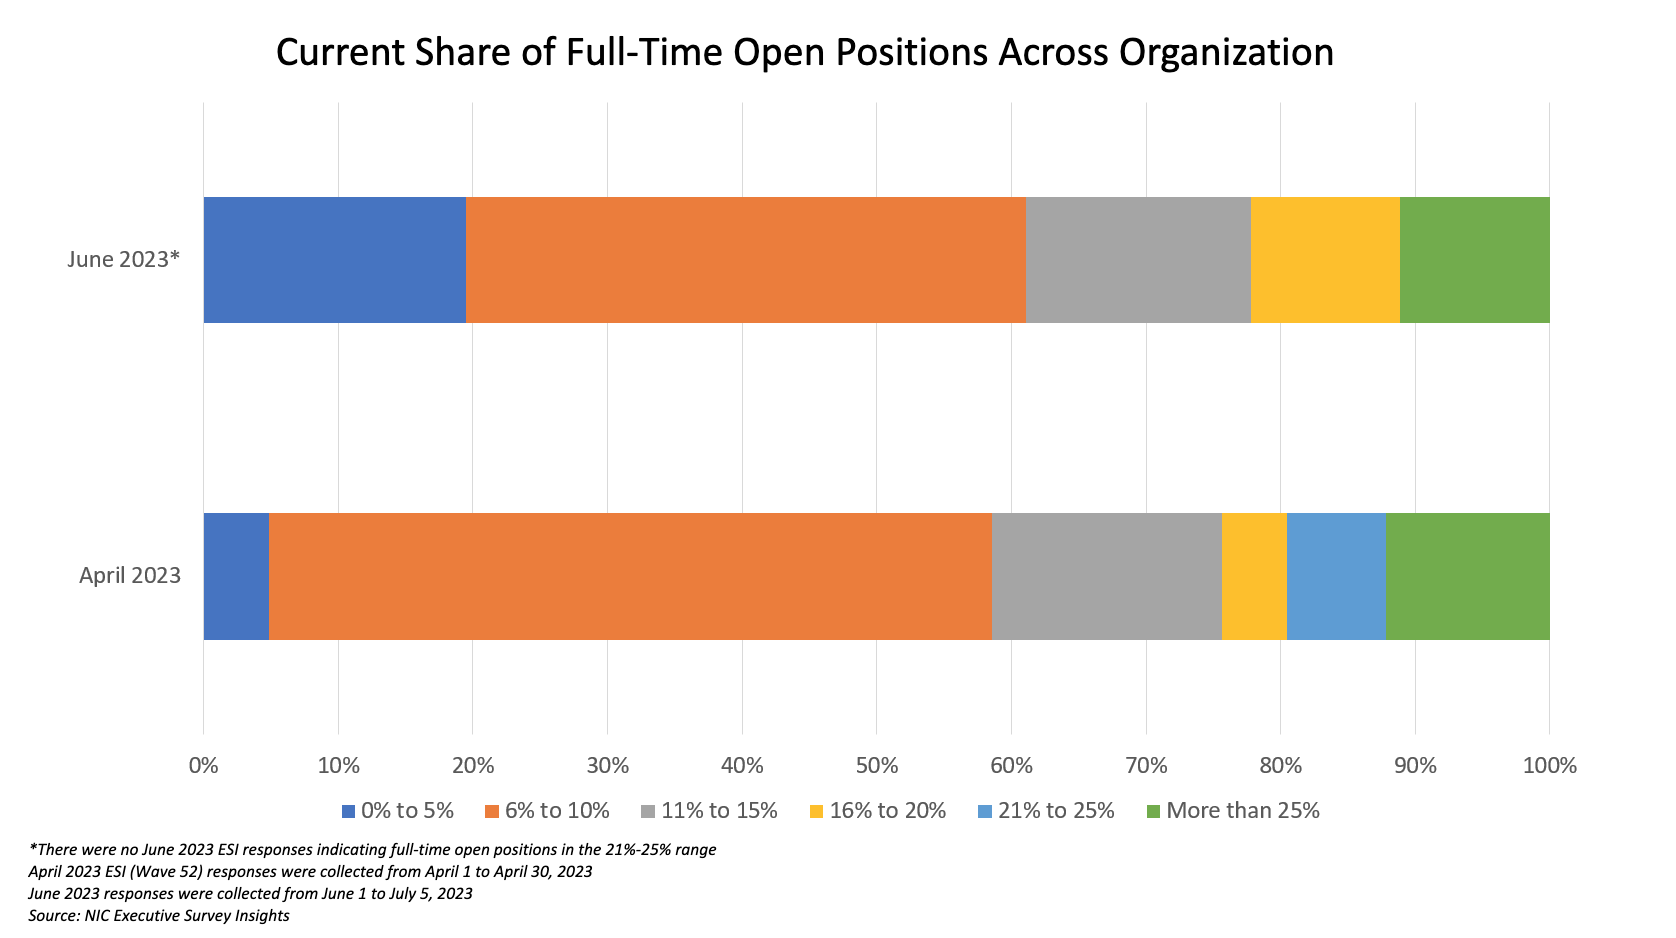
Conversely, in April 2023, one-fifth of respondents (19%) reported their range of open full-time positions to be greater than 20%. In June 2023, the proportion of respondents reporting vacancies within that range decreased to only one-tenth.
Additionally, staffing and labor related issues are still cited as challenges, but not as the issues that are currently garnering the most focus and attention. For the second month in a row, rising operator expenses is the most-cited challenge facing respondent organizations (72%). Attracting community and caregiving staff (64%) and staff turnover (59%) are the second and third most cited challenges that organizations are currently facing.
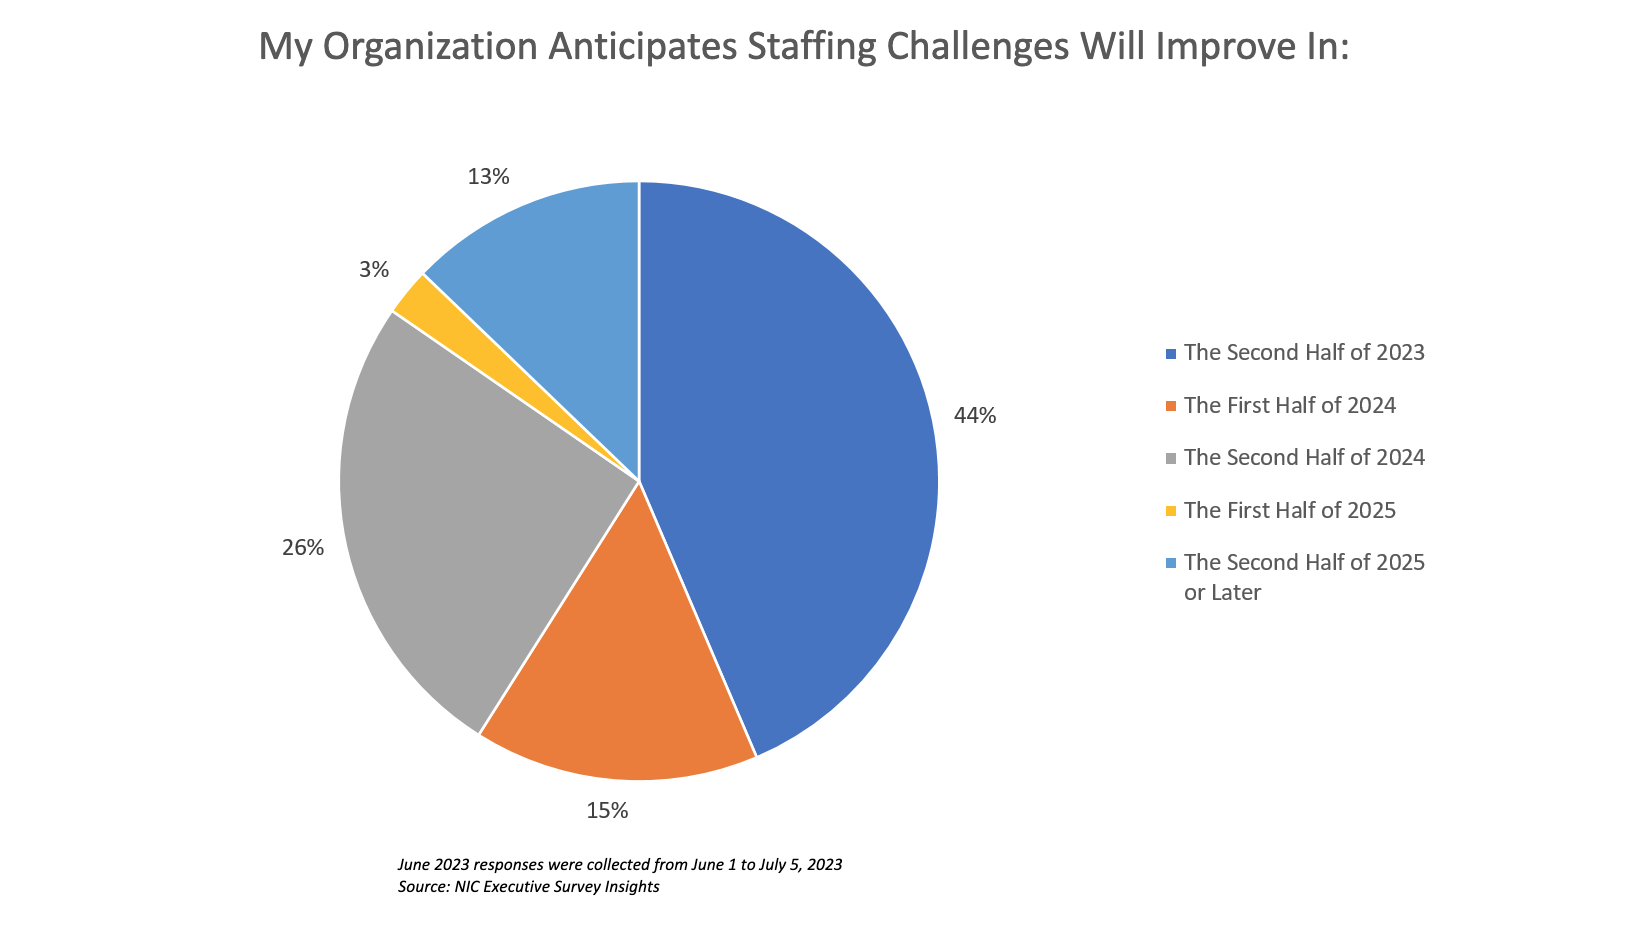
There also is some optimism expressed around the tempering of the staffing challenges that do remain. When asked when their organization anticipates staffing challenges will improve, almost one-half (44%) anticipate there will be improvement in the remaining six months of 2023. One-sixth of respondents (15%) anticipate improvement in the first half of 2024, and one-quarter (26%) anticipate improvement will come in the second half of 2024. The remaining one-sixth of respondents (16%) expect improvements in staffing challenges to take until 2025 or later.
As staffing challenges can limit the number of new residents a community can intake, the anticipated occupancy recovery timeframes of respondent organizations are noteworthy. Almost half of respondents indicate that their independent living (47%) and nursing care segments (44%) indicate their occupancy have returned to pre-pandemic levels, with approximately one-third of their memory care (37%) and assisted living care segments (30%) having returned to pre-pandemic occupancy levels.
While sizable shares of communities within each care segment have already seen their occupancies recover to pre-pandemic levels, another 20% to 30% of owners and operators across all care segments expect the recovery to take place during the remaining months of 2023. Only a small portion of respondent organizations – between 6% and 11% — anticipate occupancy recovery will take until 2025 or beyond to be realized.
June 2023 Survey Demographics
- Responses were collected between June 1 and July 5, 2023, from owners and executives of 39 senior housing and skilled nursing operators across the nation.
- Owners/operators with 1 to 10 properties comprise just under two-thirds of the sample (62%). Operators with 11 to 25 properties account for roughly one-quarter (23%) and operators with 26 properties or more account for roughly one-sixth (15%) of respondents.
- More than one-half of respondents are exclusively for-profit providers (54%), two-fifths operate not-for-profit seniors housing and care properties (41%), and 5% operate both.
- Many respondents in the sample report operating combinations of property types. Across their entire portfolios of properties, three-quarters (72%) of the organizations operate seniors housing properties (IL, AL, MC), one-sixth (15%) operate nursing care properties, and one-third (33%) operate CCRCs – also known as life plan communities.
The July 2023 ESI survey is currently open and will be collecting responses through July 31, 2023. If you are an owner or C-suite executive of seniors housing and care and would like an invitation to participate in the survey, please contact Ryan Brooks at rbrooks@nic.org to be added to the list of recipients.
NIC wishes to extend a heartfelt thank you to the owners and operators who have contributed to this survey over the past three years. It is remarkable that we have now completed more than 50 waves of surveys. We have surveyed through numerous challenges — COVID-19, threats of a looming recession, labor shortages, inflation, and rising expenses — many of which still persist. As we continue to navigate through these challenges, your input and real-time insights help ensure the narrative on the senior housing and care sector is timely and accurate.
Special Note on Nursing Care Response Rates: Lower respondent numbers for nursing care communities precludes NIC from highlighting those specific results in our ESI summaries. It is our hope that these survey findings are utilized to bring insights and an improved understanding of current market conditions for each care segment. As such, if you are an owner or operator of nursing care communities, your participation in the ESI surveys is strongly encouraged. Please also feel welcome to invite other nursing care operators to participate by sharing the anonymous survey link or reaching out to Ryan Brooks at rbrooks@nic.org to have them added to the ESI distribution list. Remember, by demonstrating transparency, together we build trust. Thank you!