A Pandmeic Initiative
In spring 2020, responding to the onset of the COVID-19 pandemic, NIC launched numerous initiatives to help senior living leaders understand and improve their responses to the crisis. Given the pace of change impacting the industry, NIC began to produce a high volume of relevant and timely data and analysis more frequently than ever before. In just a few months, NIC produced an entire suite of resources aimed at improving access to data and analysis relevant to the impact of COVID-19 on the senior housing and care industry. Part of that effort was to release the NIC Intra-Quarterly Snapshot reports, which, like several other pandemic-related NIC initiatives, is still being produced today.
Each monthly report, based on three-month rolling data from NIC affiliate NIC MAP Vision, provides the most timely comprehensive review of the sector’s market fundamentals and trends. In addition, the report provides economic trends, inventory growth data, and occupancy rates, with analysis and insights from the NIC Analytics team, including myself and NIC Chief Economist, Beth Mace. In addition to analysis of the most recent data, the reports show three-month rolling data on either total or stabilized occupancy for both seniors housing and nursing care properties over the prior 13 months, offering a perspective on broader trends.
Today, Intra-Quarterly Snapshot reports continue to provide a powerful and closely watched means to stay ahead of industry trends, even as senior housing markets sustain a fast pace of evolution and adaptation, amidst an apparent recovery.
Intra-Quarterly Snapshot Headlines Track the Trends
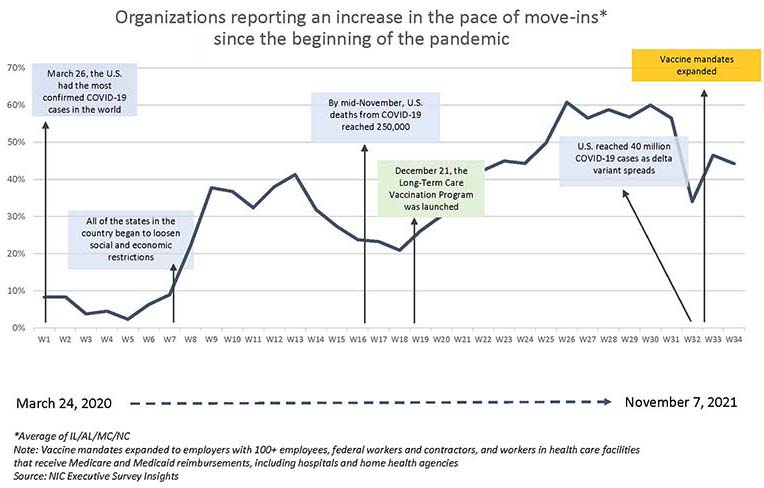
A look back at Intra-Quarterly Snapshot headlines, pulled from the top of every report published over the eighteen months, illustrates just how well these reports have tracked with industry trends, practically in real time. Each headline, as charted below, tracks with the key trends and inflection points over the pandemic to date. The The market’s initial contraction was identified in the first Intra-Quarterly Snapshot, in April 2020, and developed over subsequent months, through February 2021. From March through May, the headlines reflect cautious optimism of stabilization, which then begins to take hold in June 2021, as demand improved. From July of this year, each report has reflected improvements in occupancy rates.

If we chart just the changes in occupancy and stabilized occupancy, as reported in Intra-Quarterly Snapshot headlines, we find similar tracking with current market trends.
Changes in occupancy/stabilized occupancy as reported in Intra-Quarterly Snapshot headlines.

All-occupancy is defined by NIC MAP® as percent of existing inventory’s units that are occupied by residents as of the end of the month. Stabilized occupancy is defined by NIC MAP® as the occupancy of properties that are (a) at least two years old, or (b) if less than two years old, properties that have achieved occupancy of at least 95.0% since their opening.
Phase 1: March 2020 to March 2021
From March 2020 to March 2021, the largest occupancy decreases were reported in the April and July 2020 and January 2021 reporting periods. During this period, senior housing all-occupancy fell by 8.7 percentage points (pps) and stabilized occupancy fell by 8.5pps. Meanwhile, senior housing inventory increased by 2.8%, or 17,950 units. Demand through this period, as measured by occupied units of senior housing properties for the NIC MAP Primary Markets decreased by 7.5% or 42,344 units.
Phase 2: March 2021 to June 2021
During this time period as the vaccine rollout was nearly completed for most residents in seniors housing and skilled nursing properties, occupancy started to stabilize but continued to be challenged due to inventory growth. Quarterly absorption (% change in occupied units) turned green for the first time since the onset of the pandemic. Senior housing occupancy remained largely unchanged, mainly due to inventory growth offsetting demand growth. The inventory of senior housing properties for the NIC MAP Primary Markets increased by 0.7% or 4,354 units and demand increased by 0.6% or 3,364 units.
Phase 3: June 2021 to September 2021
Occupancy started to improve as demand rebounded over the Summer of 2021. The industry registered its strongest increase in the number of occupied units since NIC MAP began reporting the data back in 2005. The inventory of senior housing properties for the NIC MAP Primary Markets increased by 0.5% or 3,441 units and demand increased by 2.3% or 12,318 units. During this period, occupancy saw the largest quarterly growth since 2005 of 1.4pps.
To view what is happening today, and to gain insight into the continuation of occupancy gains, see the recently released October 2021 Intra-Quarterly Snapshot report.
Future Outlook
The October Intra-Quarterly Snapshot reveals that senior housing stabilized occupancy rose for the fourth consecutive reporting period. Notably, the stabilized occupancy rate for senior housing increased to 82.6% in the October 2021 reporting period for the NIC MAP Primary Markets, up 1.6pps from its time series low of 81.0% in the June 2021 reporting period and 0.4pps from the September 2021 reporting period on a three-month rolling basis. Senior housing stabilized occupancy continued the road to recovery but remained seven full percentage points below pre-pandemic March 2020 levels of 89.6%.
We cannot yet know how pandemic-derived challenges will unfold in future months, or when they will be fully behind us, but as the Intra-Quarterly Snapshot’s headlines reveal, the senior housing industry has weathered this extremely difficult period and begun the path to recovery.
At the 2021 NIC Fall Conference, senior housing constituents, while addressing the most pressing challenges facing the industry, nevertheless demonstrated reasons for optimism over the short, intermediate, and long term. The positive gains in occupancy over the last four intra-quarterly reporting periods provide a bullish indicator that the senior housing market outlook remains positive. Taken in combination with other market realities, such as the resilience of need-based demand, the ready availability of affordable financing, and major demographic tailwinds, conference attendees were understandably ready to look to the future with excitement and renewed positive energy.
Many conference attendees reflected on the past eighteen months, which for many may have been the toughest period in memory. Analysts may agree that the senior housing sector underwent perhaps its most severe era of demand loss and uncertainty on record. However, as revealed in every month’s Intra-Quarterly Snapshot, the industry is clearly demonstrating that, through innovation, collaboration, creativity, and risk tolerance, it is agile and resilient enough to bounce back even from that.
The data underlying every Intra-Quarterly Snapshot report is available to NIC MAP Vision clients. Data highlights, along with expert analysis and commentary, are provided in the complimentary Intra-Quarterly Snapshot monthly publication, available for download on nic.org.
The November 2021 IQ Snapshot report will be released on nic.org on Thursday, December 9, 2021 at 5:00pm.