NIC Analytics released the 2Q 2022 NIC Lending Trends Report today. The quarterly report, available for free to NIC’s constituents, currently tracks $86.8 billion in senior housing and nursing care loans. The report includes data over five years for construction loans, mini-perm/bridge loans, and permanent loans from 3Q 2016 through 2Q 2022.
Takeaways from the 2Q22 NIC Lending Trends Report
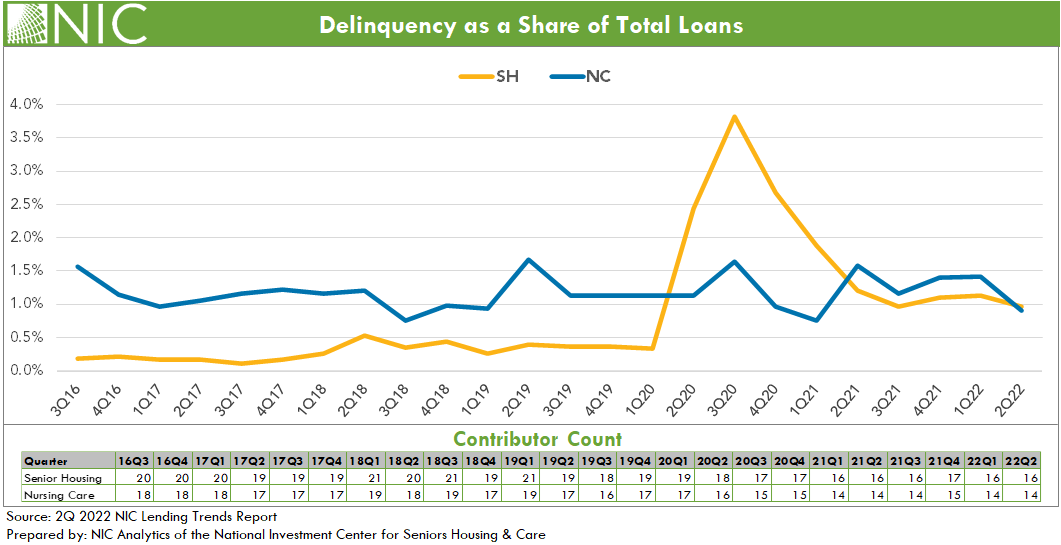
The number of delinquent loans continued to edge lower in second quarter 2022 but remains elevated from pre-Covid levels for senior housing. Senior housing delinquencies fell back to third quarter 2021 levels. The delinquency rate (delinquencies as a share of total loans) for both senior housing and nursing care declined and stood at 1.0% for senior housing and 0.9% for nursing care. Despite this overall improvement in delinquency rates, some foreclosures were reported for the sample in second quarter 2022 for both senior housing and nursing care.
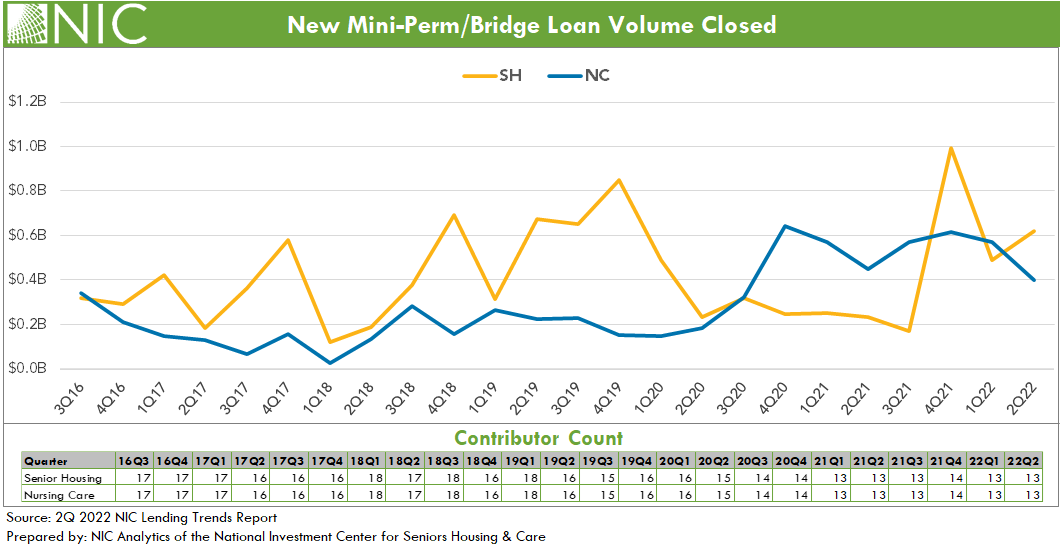
New mini-perm/bridge loans closed for senior housing were up in second quarter 2022 following a sharp decline in first quarter 2022. On a same-store basis, the quarter-over-quarter increase was 27.0% for senior housing. Nursing care mini-perm/bridge loan closings had a second quarter of negative growth with 7.2% decline in first quarter 2022 and 29.7% in second quarter 2022. However, the new mini-perm/bridge loan closing volume for nursing care remained elevated compared with pre-pandemic levels. The heightened mini-perm/bridge loans in combination with the lowered permanent loans suggests: (1) some lenders may currently be more comfortable issuing a mini-perm over permanent loan for some deals, and (2) the need for financing solutions like mini-per/bridge loans to support business operations, in the midst of relatively low occupancy levels in general and high inflation.
For the sample of lenders in the Lending Trends Report, nursing care new construction loan closings hit a new peak in second quarter 2022, the highest level since at least 2016 but still relatively low in comparison to senior housing. The quarter-over-quarter same-store growth for nursing care new construction loan closings was 15.1% in second quarter 2022. Senior housing new construction loan closings continued to increase through the second quarter of 2022 at a growth of 47.1% on a same-store quarter-over-quarter basis. However, the senior housing new construction loan volume closed remained below its recent peak in third quarter 2021.
Looking ahead. These trends may differ later in the 2022 data set as higher interest rates and inflation start to impact loan volumes and construction activities. Notably, in third quarter 2022, construction starts for senior housing and nursing care weakened and showed signs of a looming slowdown, according to NIC MAP Vision data. Additionally, construction spending in the U.S. fell into negative territory with negative 0.6% in July 2022 and negative 0.7% in August 2022, and pending home sales in the U.S. had the largest contraction in September 2022 year-over-year since the start of the pandemic in April of 2020, according to the U.S. Census Bureau. Further, debt market yield spreads continue to remain elevated as investors require additional yield to take more perceived risk due to rising interest rates and inflation.
Note: These data are not to be interpreted as a census of all senior housing and skilled nursing lending activity in the U.S., but rather reflect lending activity from participants included in the survey sample only.
The 3Q2022 NIC Lending Trends Report is scheduled be released in mid-February 2023.
Interested in participating? The NIC Lending Trends Report helps NIC Analytics to deliver on NIC’s mission to enable access and choice by further enhancing transparency of capital market trends in the senior housing and care sectors. We very much appreciate our data contributors. This report would not be possible without them.
If you would like to participate and contribute your data, please contact us at analytics@nic.org. As a courtesy for providing data, data contributors receive this report early before publication on the website. The information provided as part of the survey will be kept strictly confidential. Individual answers will be combined with the answers of all other respondents. Data acquired from this survey will only be reported in the aggregate, and therefore, the resulting aggregated data will not be attributed to you or your company upon distribution.