“Business as Usual” at People’s United: A Conversation with Matthew Huber

NIC Chief Economist Beth Mace recently talked with Matt Huber of People's United about the merger, the benefits for borrowers, and the outlook for the sector.

This past February, M&T Bank Corporation announced its intention to merge with People’s United Financial, Inc. with M&T Bank as the surviving entity. The merger—expected to close in October—brings together two powerhouse seniors housing and care lenders.

Matthew_Huber

The combined company will include about $200 billion in assets, and a network of nearly 1,100 branches spanning 12 states from Maine to Virginia.

People’s United is meanwhile open for business, says Matthew Huber, Market Manager of Healthcare Financial Services at The Bank. His team continues to close loans on a timely basis and provide commercial banking services.

NIC Chief Economist Beth Mace recently talked with Huber about the merger, the benefits for borrowers, and the outlook for the sector. Here is a recap of their conversation.

Mace:  What does the merger mean for existing seniors housing and skilled nursing clients of both organizations? 

Huber: M&T has a big presence in the seniors housing space and has a long-term commitment to the industry. So, I think the merger will be really good for the seniors housing and care borrowers at People’s United. M&T has a robust platform with permanent agency financing from Freddie Mac and FHA/HUD. Borrowers will have more solutions. People’s United is about half the size of M&T. Given their size, we’ll have more room to grow and participate in larger seniors housing and care transactions.   

Mace: Will the merger affect how you traditionally look at borrowers that seek debt funding for seniors housing and skilled nursing mergers?  How about recaps and rehabs? 

Huber: Between now and the actual closing of the merger, we are operating as two separate companies. At People’s United, we have continued to do exactly what we’ve been doing for the last number of years – focus on relationships, advice and tailored solutions. We’re winning new business on a consistent basis. In April, we closed on a refinance loan for Masonicare at Mystic, a life plan community in Connecticut. We recently won a term sheet to provide construction financing for a new project by RSF Partners in New York State. We’re also refinancing a Benchmark property in New England. We’re sticking close to our credit policy in terms of price and structure. Given the pandemic, we’re still winning business because of our relationships with our customers. We’re proud of that.  

Mace: Are you open for business for new development? 

Huber: Yes. 

Mace: What about turnarounds? 

Huber: Other than new construction, we only finance properties with in-place cash flows. If it’s a turnaround, we can only finance what current cash flows can support. 

Mace: You’ve traditionally been a relationship bank, working with repeat clients that have proven track records with experience in either seniors housing or skilled nursing. What should potential new borrowers be prepared to provide you to become eligible for new debt? 

Huber: Though it’s a big industry, it’s small in terms of the number of companies and banks that are fully engaged in seniors housing and care. It would be surprising if a known company with a portfolio did not have a banking relationship. If we don’t know the company, then we ask other industry stakeholders such as attorneys and accountants if they know the company. Mostly, new borrowers for us must be regional in scope and have multiple properties. If they’re one of our top 20 prospects, they have to provide the same type of information we would ask from anyone making a new request. That includes a real estate schedule of their existing properties to see how they’re doing. We conduct full due diligence. As much as we’re seeing green shoots of positivity in the industry, we’re not out of the woods yet. I need to know borrowers have the liquidity to get them through this time, however long that may be. We’re going with the tried-and-true companies that have been there and done that, whether they’ve banked with us or not.   

Mace: You’ve significantly grown People’s United lending volume with the seniors housing and skilled nursing sector in the last few years. What is your secret to success? 

Huber: When I joined People’s United about four years ago, our healthcare portfolio was about $400 million in balances, with about half in seniors housing and the other half to hospitals. Today we are at about $2.5 billion. We’ve grown by hiring the right people and consistently delivering solutions for our customers. I have an experienced staff of five relationship managers who’ve been in the industry for decades. They know commercial banking and they know the healthcare industry. We have consistent solutions and don’t waiver from them. Our process is very simple from term sheet to approval. Certainty of execution is so important to the client and they know what they’re getting from us because we don’t change our terms. We don’t come in the day before closing and ask for more equity or covenants. Our customers are important to us. We learn a lot from them, and we truly enjoy building relationships with them.  

Mace: With the worst of the pandemic hopefully behind us, how will your lending practices change post-COVID?  

Huber: I think we’ll go back to more of a limited recourse requirement once we see facilities have stabilized. Until then, we have increased our requirements to full recourse, though we give borrowers a path to release based on performance. Prior to the pandemic, we were asking for 25% -50% recourse, depending on the deal or borrower. We don’t do non-recourse construction loans.   

Mace: Have you seen a slowdown in construction because of cost overruns? 

Huber: We have seen minor slowdowns in construction, but nothing too concerning yet. The cost of materials and overruns are mind boggling. The projects are so big, $70 million to $80 million. So, having strong sponsors is key for construction projects currently underway should challenges arise that dictate the need for additional project funding. 

Mace: Are you optimistic for the recovery of the sector in 2021?  Beyond 2021? 

Huber: I am optimistic. Seniors housing and care has done a good job of getting residents vaccinated. There is still some work to be done on the employee side. But I think it’s headed in the right direction. We’re starting to see some positivity on occupancy. I think it’s going to take a little longer than we hoped for properties to stabilize. The recovery will continue into the first half of 2022. But I’m optimistic. Baby boomers are 75 years old. The first ones turn 80 in five years and that’s when the usage of seniors housing really escalates. Skilled nursing will undergo some changes that have been accelerated by the pandemic. We’re not going back to the way skilled nursing was in 2019 with a lot of short stays. More rehab will be done at home and we’ll need fewer beds over time. Nursing homes will do more home care for their customers coming out of the hospital.   

Mace: What gives you pause about the sector if anything? 

Huber: I don’t have a crystal ball, but uncertainty gives me pause. Telehealth and Home Care will impact our customer base, and anything like that causes uncertainty in cash flows. Assisted living is still somewhat of a choice. Memory care is coming back quickly. But we need to keep our eye on assisted and independent living and how skilled nursing will mature as an industry. I see a positive future. But the question is: will occupancies be back in the high 80s by the end of the year, or not? 

Mace: Is there anything else you would like our readers to know about People’s United? 

Huber: We are still open for business. We have one of the most experienced teams in the industry. Our team includes: Walt Unangst, David Canestri, Claudia Gourdon, Ginger Stolzenthaler and Ryan Zyskowski. The upcoming merger is a plus for customers. M&T Bank is a well-known lender in this industry and we are confident the combined company will deliver much value to our clients. Borrowers will be in good hands regardless of the name over the door.

Cautious Optimism: Occupancy Rates Appear to Have Hit Bottom

Senior housing occupancy rates may have reached the low point in February and March of 2021; however, when it will return to pre-pandemic levels remains a question.

While it is still early to say if the seniors housing and care market is showing strong and durable signs of a recovery, several indicators from the NIC MAP® Data, powered by NIC MAP Vision, and from NIC Analytics have sparked cautious optimism and suggest that we may be at least at the bottom of the cycle. Occupancy rates may have reached the low point in February and March of 2021; however, the outlook for when occupancy will return to pre-pandemic levels remains a question.

In this blog, we look at four indicators from NIC MAP data and NIC Analytics that measure occupancy, move-ins and move-outs, overall demand, and lead volumes, which all do seem to point to modest signs of inflection and portray the sector’s current level of performance.

Top Findings:

  • The just released NIC Intra-Quarterly Snapshot shared the latest reported NIC MAP data. This data showed that the occupancy rate for seniors housing edged up 0.3 percentage points in the May 2021 reporting period for the NIC MAP Primary Markets on a three-month rolling basis above its all-time low of 78.7% in the March 2021 reporting period, but it remained very low by historic standards.
  • NIC MAP intra-quarterly data showed that majority nursing care (NC) properties had the largest increase in occupancy since March 2021 reporting period, up 70 basis points (bps) but at 74.7%, it is still 11.9 percentage points (pps) below the pre-pandemic March 2020 level.
  • Sixty-seven of the 99 NIC MAP Primary & Secondary Markets for seniors housing saw an increase in occupancy since March 2021. Over the same period, sixty-eight markets for majority nursing care experienced an increase in occupancy rates, according to May 2021 NIC MAP intra-quarterly data.
  • The NIC MAP Actual Rates Report showed that move-ins reached new highs in March 2021 for both majority independent living and majority assisted living since NIC began reporting actual rates data in 2015.
  • Wave 28 of NIC Executive Survey Insights also reported lead volumes increasing and move-ins accelerating for some survey respondents, resulting in gains in occupancy for more than 50% of respondents.
  • The NIC MAP Skilled Nursing Monthly Report, released by NIC MAP Vision, with data through March 2021 showed that skilled nursing property occupancy increased for a second month in a row. It increased 49 bps from February to end March at 71.6%. It is up 89 bps from the low set in January 2021.

NIC MAP Intra-Quarterly Data – As of May 2021

Exhibit 1 below depicts that the all-occupancy rate for seniors housing inched up 0.1 percentage point to 79.0% in the May 2021 reporting period for the NIC MAP Primary Markets on a three-month rolling basis from the April 2021 reporting period. This placed the occupancy rate 0.3 percentage points above its all-time low of 78.7% in the March 2021 reporting period, but it remained very low by historic standards. Prior to the pandemic in the March 2020 reporting period, occupancy was 87.5% — 8.5 percentage points higher than the most recent data point.

Since its low point in the March 2021 reporting period, the all-occupancy rate for majority assisted living (AL) was up 0.3 percentage points to 75.8% for the NIC MAP Primary Markets on a three-month rolling basis, although there was little change from the April 2021 reporting period. Majority independent living (IL) properties saw an increase of 0.2 percentage points since March 2021, with a gain of 0.1 percentage point in both April and May.

Majority nursing care (NC) properties had the largest increase in occupancy since March 2021 reporting period, up 70 bps but at 74.7%, it is still 11.9 pps below the pre-pandemic March 2020 level. The relatively large improvement shows the positive impact early inoculation has had on occupancy rates for majority nursing care properties. In addition, skilled nursing properties have benefitted from the resumption of elective surgeries at hospitals since recuperation and post-acute care from knee and hip surgeries often take place in skilled nursing settings.

The bottom line is that for the overall NIC MAP Primary Markets aggregate occupancy rate, no declines have been reported for two consecutive monthly reporting periods (April and May 2021) across all property types.

Exhibit 1 – Intra-Quarterly Occupancy by Reporting Period – Data as of May 2021

IQ 1


Exhibit 2 below shows that occupancy increased or remained stable in 65 of the 99 NIC MAP Primary & Secondary Markets for AL in the May 2021 reporting period compared to March 2021 levels. Thirty-two markets’ occupancy continued to slip further, and two remained stable.

For IL, 60 of the 99 Primary & Secondary Markets had higher occupancy rates in May 2021 compared to March 2021 levels.

Overall, 67 of the 99 NIC MAP Primary & Secondary Markets for seniors housing saw an increase in occupancy since March 2021. Over the same period, 68 markets for majority nursing care experienced an increase in occupancy rates.


Exhibit 2 – Distribution of the NIC MAP Primary & Secondary Markets (Top 99 Markets)

IQ 2


NIC MAP Seniors Housing Actual Rates Data – As of March 2021

The recently released 1Q2021 NIC MAP® Seniors Housing Actual Rates Report showed that for the first time since the pandemic unfolded in the U.S. and began to influence the seniors housing sector, move-ins outpaced move-outs for both majority independent living and majority assisted living, as shown in Exhibit 3.

Notably, move-ins reached new highs in March 2021 for both majority independent living (3.0%) and majority assisted living (3.7%) since NIC MAP began reporting actual rates data in 2015. This corroborates the increase in lead volume captured in NIC’s Executive Survey Insights, which has been reportedly above pre-pandemic levels for some data contributors.


Exhibit 3 – Majority Assisted Living and Majority Independent Living – Move-ins vs. Move-Outs

AR


NIC Executive Survey Insights (Wave 28 Survey)

Wave 28 of NIC’s Executive Survey Insights also reported lead volumes increasing and move-ins accelerating for some survey respondents, resulting in gains in occupancy for more than 50% of respondents.

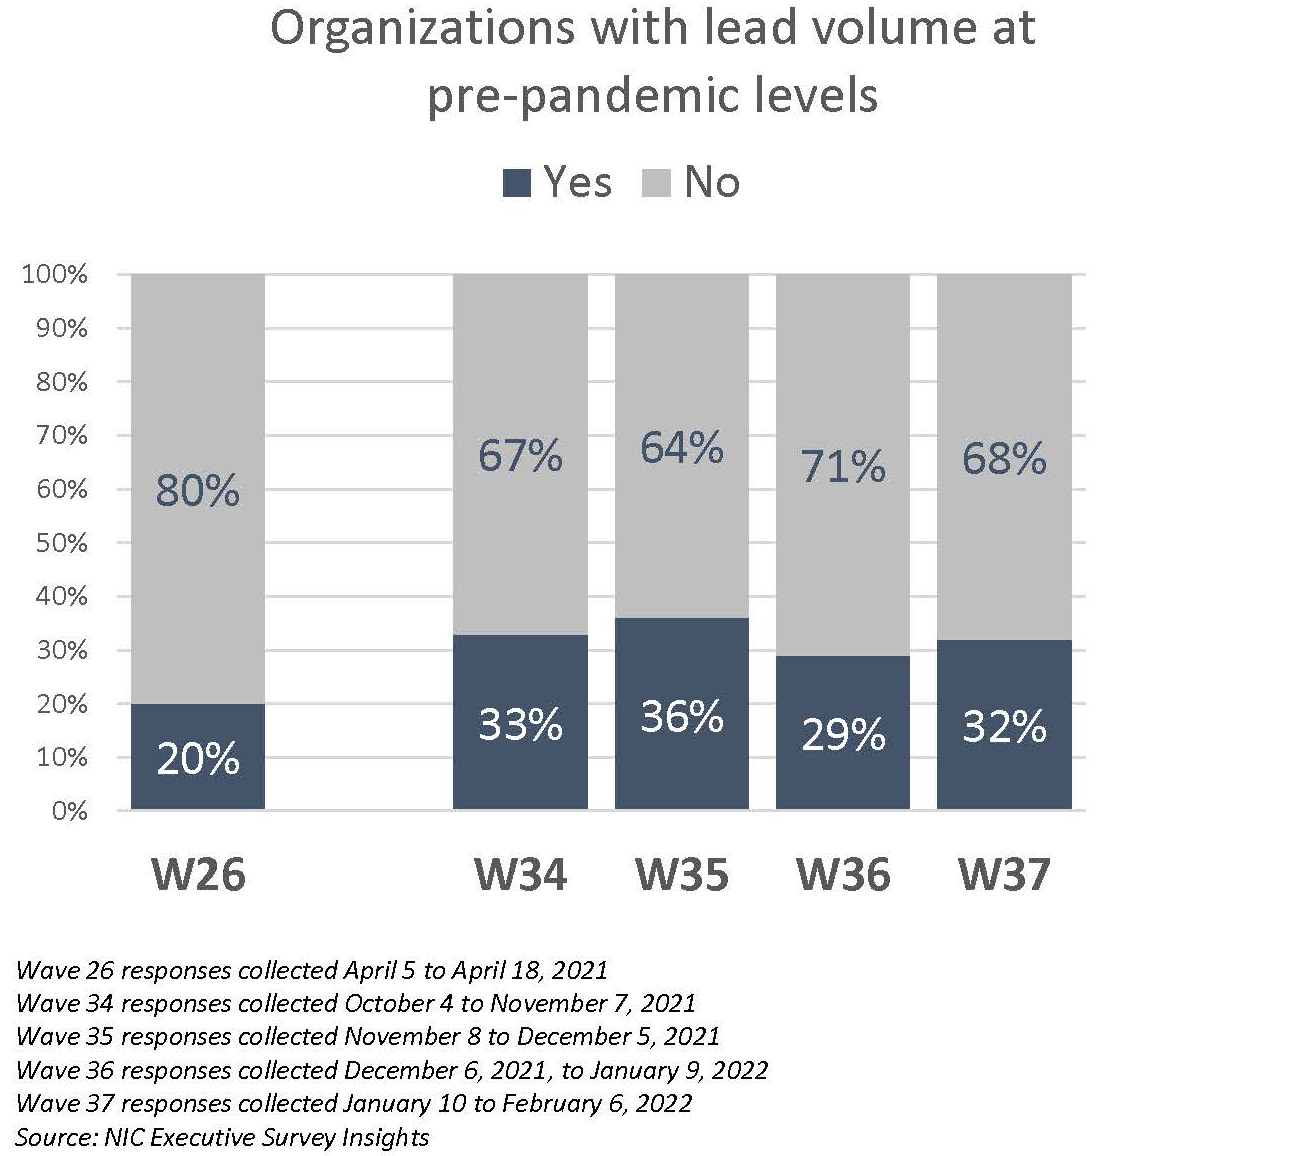
Exhibit 4 below depicts that since early April, respondents were asked if their organizations had seen an increase in resident lead volume since the beginning of the year and, if they had, if lead volume is above pre-pandemic levels. As shown in the chart below, about nine out of ten organizations reported an increase in lead volume (89%). Additionally, one-third of organizations report lead volume currently above pre-pandemic levels (35%) compared to 20% in Wave 26 conducted just one month prior. Regardless of reports of notable improvement in lead volume, nearly two-thirds of survey respondents expect their organizations’ occupancy rates to recover to pre-pandemic levels sometime in 2022. This sentiment has remained consistent since first reported in late February (Wave 23). In fact, roughly 50% to 70% reported upward changes in occupancy in the Wave 28 survey


Exhibit 4 – Lead Volume and Occupancy by Care Segment According to Data Compiled by NIC Executive Survey Insights (Wave 28 survey)

ESI Final


NIC Skilled Nursing Data Initiative – Data as of March 2021

The NIC MAP Skilled Nursing Monthly Report released by NIC MAP Vision, with data through March 2021, showed that skilled nursing property occupancy increased for a second month in a row. As shown in Exhibit 5 below, it increased 49 bps from February to end March at 71.6%. It is up 89 bpsfrom the low set in January 2021. The expectation was occupancy would increase given the decline in COVID-19 cases across the country. Although occupancy seems to have stabilized, it remains very low compared to pre-pandemic levels. It is 13.2 percentage points below the February 2020 occupancy when it was 84.8%.

Nursing care properties in urban areas reported the highest occupancy rate in March 2021 at 72.5%, followed by rural (69.8%) and urban clusters at 69.3%. The largest increase in occupancy has been reported in rural, up 107 bps from February 2021 levels.

Exhibit 5 – Skilled Nursing Property Occupancy – Data as of March 2021

SNF-Final

These signs are promising and suggest that positive demand is returning. The full recovery from the COVID-19 crisis, however, will likely not be immediate or fast. Operators have not only suffered significant losses due to the COVID-19 pandemic but also had to navigate through the COVID-19-related recession amid slowing rates of move-ins and rising operating expenses to protect their residents. While some entire industries shut down such as restaurants, seniors housing remained open despite a host of proliferating challenges related to PPE, testing, infection control, staffing challenges, a patchwork of disparate regulations, lockdowns, limits on visitation, and social distancing. This agility, in and of itself, shows the resilience and endurance of the seniors housing market through the pandemic.

Thanks to the way vaccines have been distributed and administered, prioritizing the population most vulnerable to the virus, namely older Americans and residents of skilled nursing and seniors housing properties, COVID-19 cases in the U.S. have fallen to levels not seen since March 2020 and virus cases in skilled nursing properties dropped to lowest point in pandemic, according to CMS data compiled by NIC’s Skilled Nursing COVID-19 Tracker. The positive impact early vaccinations have had on the sector started to translate into positive demand, higher lead volumes, and improvements in occupancy rates.

With 15 years’ hindsight, the seniors housing market plays a critical role in supporting and helping America’s seniors age comfortably. The pandemic has revealed hidden and long-standing weaknesses, but also presented enormous opportunities for innovation and growth. Consumer demand and housing needs may have changed but the value proposition of seniors housing care settings in the post-pandemic world have strengthened. High quality care is essential for continuum of care in seniors housing. However, a sense of belonging, socialization, and engagement are the value propositions of a continuum of wellness. This will lead to a healthier resident outcome, a stronger seniors housing market, and a faster recovery for the sector, especially, as demand and the population of seniors increase and the baby boomer generation ages.

Looking ahead with any certainty is always difficult, but there is an air of cautious optimism regarding the future trajectory of seniors housing. The industry will recover if for no other reason than the fact that the industry’s value proposition and product offerings are critical for care and housing options for today’s older adult population as well as for America’s rapidly aging population. Today’s oldest baby boomer is 75 and quickly approaching the age of needing seniors housing (age 82 or more). Additionally, the sector offers compelling and emerging opportunities in both healthcare collaboration and population health management, as evidenced by the pandemic, and as critically needed to stave off staggering societal healthcare costs. And lastly, there is a better understanding of the sector by institutional capital providers who hold significant amounts of investable and targeted capital.

Interested in learning more about NIC MAP data? To learn more about NIC MAP data, powered by NIC MAP Vision, and about accessing the data featured in this article, schedule a meeting with a product expert today. 

Skilled Nursing Occupancy Increased in March for Second Straight Month, But Remains Low

Key takeaways from the March 2021 Skilled Nursing Monthly Report, from NIC MAP® Data Service, powered by NIC MAP Vision.


Medicare Patient Day Mix Continues Decline.


NIC MAP® Data Service, powered by NIC MAP Vision, released its latest Skilled Nursing Monthly Report on June 3, 2021, which includes key monthly data points from January 2012 through March 2021.

Here are some key takeaways from the report:

Occupancy

Skilled nursing property occupancy increased for a second month in a row, increasing 49 basis points from February to end March at 71.6%. It is up 89 basis points from the low set in January. The expectation was occupancy would increase given the decline in COVID-19 cases across the country, but the question remains of how fast it will recover. Although occupancy seems to have stabilized, it remains very low compared to pre-pandemic levels. It is 13.2 percentage points below the February 2020 occupancy when it was 84.8%. There is still cautious optimism, but the next few months of data will be critical in order to verify if the recovery in occupancy continues.

SNF Blog Slide 15 March 2021

Medicare

Medicare patient day mix dropped 127 basis points from February to end March at 12.2%. It has decreased three months in a row and is now down 309 basis points from the recent high set in December 2020. In addition, Medicare revenue mix declined as well, falling 201 basis points from February, and ending March at 21.4%. This suggests the utilization of the 3-Day Rule Waiver is declining which makes sense as COVID-19 cases declined significantly since January. The 3-Day Rule Waiver was implemented by Centers for Medicare and Medicaid Services (CMS) to eliminate the need to transfer positive COVID-19 patients back to the hospital to qualify for a Medicare paid skilled nursing stay.

SNF Blog Slide 7 March 2021


Managed Medicare

Managed Medicare patient day mix was relatively flat from the prior month, ending March at 7.8%. However, it is up 245 basis points from the pandemic low set in May of 2020 when many states restricted elective surgeries and some skilled nursing operators were unable to admit patients. In addition, managed Medicare revenue mix ended March at 11.0% and is up 183 basis points from the end of 2020 and up 266 basis points from its low also set in May of 2020. The slight increase in occupancy and managed Medicare patient day mix of late is welcomed news but the question remains of if, and when, patient admissions will get back to pre-pandemic levels.


SNF Blog Slide14 March 2021


Medicaid

Medicaid revenue mix continued to increase as it ended the month of March at 49.3%. It continues to inch back to a more historical normal level. The pre-pandemic level in February 2020 was 55.0%. It is up 228 basis points from the pandemic low of 47.0% set in December 2020. In addition to lower overall admissions, the waiver of the 3-Day Rule also likely played a role during the pandemic in regard to lower Medicaid revenue mix as COVID-19 positive patients converted to Medicare from Medicaid.


To get more trends from the latest data you can download the Skilled Nursing Monthly Report at https://www.nic.org/skilled-nursing-data-initiative. There is no charge for this report.

The report provides aggregate data at the national level from a sampling of skilled nursing operators with multiple properties in the United States. NIC continues to grow its database of participating operators in order to provide data at localized levels in the future. Operators who are interested in participating can complete a participation form here. NIC maintains strict confidentiality of all data it receives.


Interested in learning more about NIC MAP data? To learn more about NIC MAP data, powered by NIC MAP Vision, and about accessing the data featured in this article, schedule a meeting with a product expert today. 

Study Shows Care Setting Impact on COVID-19 Mortality

NIC provided a grant to NORC at the University of Chicago to study the disparate effects of the pandemic on different seniors housing and care settings.

NIC provided a grant to NORC at the University of Chicago (NORC) to study the disparate effects of the pandemic on different seniors housing and care settings. The study results have just been released.

The analysis examines mortality rates by property level of care – independent living, assisted living, memory care, and skilled nursing – and provides a comparison to seniors aged 75 and older living in non-congregate settings (single family homes and apartments).

The study focused on data from 3,817 seniors housing properties across 113 counties in five states – Colorado, Connecticut, Florida, Georgia, and Pennsylvania. About two-thirds of independent living properties (67%), assisted living properties (64%), and memory care properties (61%) experienced no COVID-19-related deaths. Thirty-nine percent (39%) of skilled nursing facilities (also known as nursing homes) experienced no COVID-19-related deaths during the same period.

Also, among the study’s key findings is that COVID-19 mortality rates across seniors housing increased as the health and caregiving complexity of residents increased, with the highest percentages occurring in memory care settings and skilled nursing properties. By including a comparison to seniors aged 75 and older living in non-congregate settings in the broader geographical areas, study findings suggest that residents who live in independent living properties were not at higher risk by virtue of their congregate care setting.


Throughout 2020, average adjusted mortality rates from COVID-19 in skilled nursing were 59.6 per 1,000, likely driven by the advanced age, frailty, and comorbidities of the residents. By contrast to skilled nursing, assisted living mortality rates were two-thirds lower at 19.3 deaths per 1,000 residents. Resident deaths in independent living settings were statistically comparable to the experience of older adults living in non-congregate settings in the broader county.

Adjusted mortality rates in memory care were 50.4 per 1,000 residents, which is statistically comparable to skilled nursing. Memory care units faced particular challenges with infection control, since seniors who have cognitive impairments are more likely to require additional care and support for basic needs.

In a secondary analysis that looked specifically at continuing care retirement communities (CCRCs) residents, CCRCs were associated with a significantly lower expected mortality rate when compared to non-CCRCs. The mean expected mortality rates for CCRCs across all care segments was 10.0 per 1,000 as compared to 19.9 per 1,000 in non-CCRCs.

The study also included a dozen interviews with seniors housing operators and eight state affiliates of LeadingAge and Argentum, organizations that serve non-profit and for-profit aging services, to understand the context of the COVID-19 case and death data, and the challenges they faced during the pandemic. These qualitative interviews helped place the study’s quantitative results in context and help readers understand some of the challenges faced in managing COVID-19 in these settings, including PPE shortages, delayed testing results, and a rapidly changing regulatory environment across all levels of government.

A second phase of the study is being planned to build upon these findings by comparing death rates across levels of care while risk-adjusting for age, health status, and demographic characteristics, as well as understanding the impact of COVID-19 on all-cause mortality by care setting. These data findings will be critical to improving the public’s understanding of the safety levels within the various seniors housing care segments. Phase 2 of the COVID-19 research study is expected to be completed by November 2021.

To view the study’s complete findings and conclusions, please see the Final Report and detailed Technical Report by visiting NIC’s COVID-19 study landing page.

U.S. Jobs Increase by 559,000 in May

The Labor Department reported that nonfarm payrolls rose by 559,000 in May 2021. Revisions did little to improve the disappointing April 2021 gain of 278,000.

The Labor Department reported that nonfarm payrolls rose by 559,000 in May 2021. The consensus estimates for May had been for a gain of 675,000. Revisions did little to improve the disappointing April 2021 gain of 278,000. Recent monthly job increases have been disappointing for this point in the recovery. Indeed, despite the increase, job levels remain 7.6 million below the pre-pandemic levels of February 2020.

Jobs_060421

Notable job gains occurred in leisure and hospitality (292,000), in public and private education (144,000) and in health care and social assistance (46,000). These were employment sectors most hurt during the pandemic.  

Separately and from a separate survey, the Labor Department reported that the unemployment rate fell back 0.3 percentage point to 5.8% in May from 6.1% in April. The jobless rate is now 2.3 percentage points above the pre-pandemic level of 3.5% seen in February 2020, but well below the 14.7% peak seen in April 2020. The underemployment rate or the U-6 jobless rate was unchanged at 10.2% down from 10.4% in April 2021. This figure includes those who have quit looking for a job because they are discouraged about their prospects and people working part-time but desiring a full work week.  

The number of long-term unemployed (those jobless for 27 weeks or more) declined by 438,000 to 3.8 million but is 2.6 million higher than in February 2020, suggesting that this continues to be a very challenging time for many Americans. Long-term unemployed persons account for 40.9% of the total number of unemployed persons.  

The labor force participation rate, which is a measure of the share of working age people who are employed or looking for work was steady at 61.6% in May but is lower than in February 2020. Many workers have dropped out of the labor force since the pandemic began to take care of family members or out of fear of working and catching the virus. Indeed, in May, the number of persons not in the labor force who currently want a job was essentially unchanged over the month at 6.6 million but is up by 1.6 million since February 2020. These individuals were not counted as unemployed because they were not actively looking for work during the last 4 weeks or were unavailable to take a job. 

Average hourly earnings for all employees on private nonfarm payrolls rose by $0.15 in May to $30.33, a gain of 2.2% from a year earlier and followed an increase of $0.21 in April. The data suggests that rising demand for labor associated with the recover from the pandemic may be putting upward pressure on wages. That said, the Labor Department warns that the pandemic has affected the ability to fully interpret the wage data due to the wide swings in employment trends. 

The change in total nonfarm payroll employment for March was revised up by 15,000 from a gain of 770,000 to 785,000 and the change for April was revised up by 12,000 from 266,000 to 278,000. With these revisions, employment in April and March combined is 27,000 higher than previously reported. Monthly revisions result from additional reports received from businesses and government agencies since the last published estimates and from the recalculation of seasonal factors.  

The May data was disappointing after weak job gains in April. It may reflect ongoing health-related concerns about the pandemic and the need for workers to still take care of family members, especially school-aged children. That said, the ongoing drop in COVID cases, the widespread distribution of vaccines, and a shift in consumer confidence should support a more complete re-opening of the economy and a fuller recovery in jobs in the coming months. The weak May number also suggests that the Fed will continue in its resolve to keep interest rates low as it pursues its full employment objective.