NIC’s recent acquisition of VisionLTC and creation of NIC MAP Vision integrates the market-leading NIC MAP® Data Service with VisionLTC’s best-in-class data for investors, owners, and operators to provide significantly deeper and broader data for industry stakeholders.
Key Takeaway: NIC MAP has long been the industry leader in facilitating data transparency in the seniors housing and care sector. NIC MAP Vision combines both supply-side time series data for 140 U.S. metropolitan markets and demand-side data for properties all across the country, significantly increasing an analyst’s ability to identify all of the comparable and competitive properties in a market area.
Some Context: A few years before I joined NIC in 2016, I had a potential client who wanted a compilation of all the seniors housing and skilled nursing properties in the state of Virginia not covered by NIC, listed by address, ownership/management, number of units, unit mix, and monthly rent rates for each type of unit because they were planning to use the information to seek underserved areas for development. In scoping the project, it was determined that to accomplish the task, a researcher would at least need a map and good internet search skills—but they would also need a tremendous amount of tenacity and patience to locate and reach the right state and local licensing/regulatory agencies (for lists of those properties with licenses), the ability to search the internet for unlicensed properties, and to reach out to the right people “in the know” at local planning and zoning boards to discover properties in the development pipeline that may or may not be announced (often easier said than done). Additionally, adding to the analyst’s effort to compile all the salient information, some states only disclose that a property provides a specific service or level of care but does not identify how many beds are licensed for each type—or only licenses the whole property. In the end, many variables from disparate places needed to be gathered and judiciously classified, and it was deemed to be a very time-consuming project that would require resources beyond which was reasonable.
This affiliation is truly a game-changer. On one hand, NIC MAP® data, powered by NIC MAP Vision, continues to provide the same high-quality, supply-side data it has since 2005. The time series data of 140 metropolitan markets remains the gold standard for identifying historic patterns and trends and analyzing cycles in the seniors housing and care market fundamentals.
VisionLTC data, powered by NIC MAP Vision, goes beyond, and expands on the demand-side data with additional inventory including assisted living, memory care and nursing care licensed beds, and independent living units. With VisionLTC data and a few clicks of the mouse, an analyst now has the ability to go into any market area, no matter how small—or rural—and view details on local competitors to compile key property data.
Apples or oranges? It is of chief import when analyzing a market for senior living housing and services to designate properties as comparable or competitive.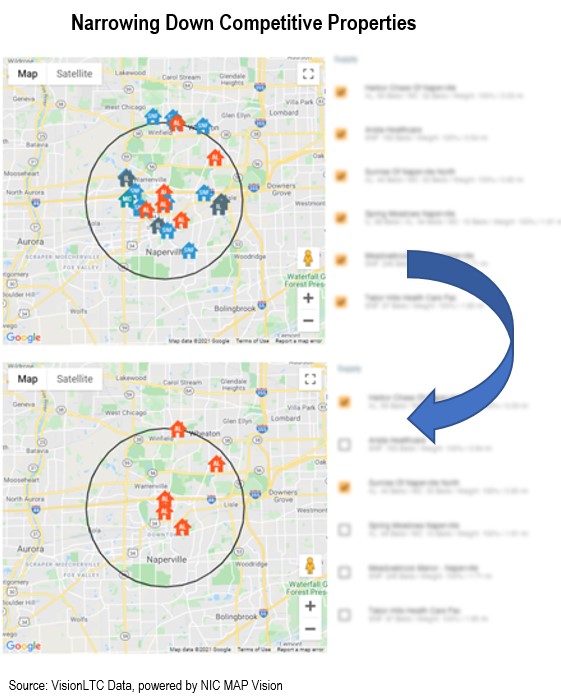 Doing so increases the accuracy of demand analyses. In most market studies, before an analyst drills down into a competitive set of properties, they need to have broad knowledge of all of the comparable seniors housing and care properties in a market area that could capture any prospective resident from the total demand pool.
- Properties that are designated “comparable” offer similar levels of care (e.g., independent living, assisted living, memory care, nursing care), and similar levels of programming and services included in the monthly fee (e.g., one meal a day, housekeeping twice a month, basic utilities, etc.).
- Once a listing of all seniors housing and care properties is created for a specific market area of interest, the analyst then categorizes them into one or more competitive sets. Communities that are designated “competitive” are further defined as offering similar levels of care, programming and services included in the monthly fee—and have comparable unit size; pricing; amenities; quality of design, fit and finish; age of physical plant; and they target the same age- and income-qualified consumer.
Comparable and competitive properties (and their respective units within) are important to differentiate, especially when conducting a study of market depth for a particular property or development project. Comparable properties must be included in the mix because they are possible selections based on care level and services offered. Competitive properties, however, may require more thoughtful consideration from the analyst to identify features that appeal to households with a particular income, affinity group, or expectations for attractiveness and features.
NIC MAP Vision powers up the process. It’s a science…and an art. In developing a competitive set for a seniors housing market study, regardless of whether it entails review of an entire county or a small neighborhood, it requires objective data (the science part) and subjective observations (the art part). Through the VisionLTC client portal, a vast variety of objective seniors housing data can be accessed and compared to put a fine point on the big picture including, but not limited to:
-
- PMA (site data): target market household demographics and associated growth rates, net worth, home values, home ownership rates, total and projected supply competitive supply
- Competition data: owner/operator, property type, payment type, unit mix, assessed property value, property sale price, mortgage amount, lot acreage and total building square footage, average online consumer review star ratings, origin of resident data
- Assisted living rate data: minimum and maximum rent data by unit type
- Medicare data: total Medicare spend per beneficiary, 30 and 90-day readmission rates, percent attributed to a Medicare ACO
- Development pipeline data: address, new or renovation, stage in development, hard costs, number of units, owner contact information and detailed notes about the project
- Labor data: position, total employment, percent labor availability by position type, FTE per licensed bed, hourly wages
- Survey performance data: number of surveys, total citations, quality of care ratings, complaints, fines
- Construction cost data: various building components and total cost per square foot
- Many additional factors can be considered to build the objective picture in a market study through the VisionLTC client portal. The analyst can drill down in a marketplace to age of units, competitive and comparable care segment 5-year supply growth rates, senior disability rates including activities of daily living (ADLs), instrumental activities of daily living (IADLs), and cognitive impairment rates.
About NIC MAP Vision:
NIC MAP Vision, an affiliate of NIC, is a leading provider of comprehensive market data for the seniors housing and care sector. NIC MAP Vision brings together two strong, well-respected, and complementary teams and platforms – the market-leading NIC MAP® Data Service (NIC MAP) and VisionLTC’s best-in-class market research analysis platform. For more information, visit www.nicmapvision.com.
Learn More About VisionLTC Data
Schedule a meeting with a Product Expert to learn more about how our product offerings can help support your business and save you time in an increasingly competitive market.