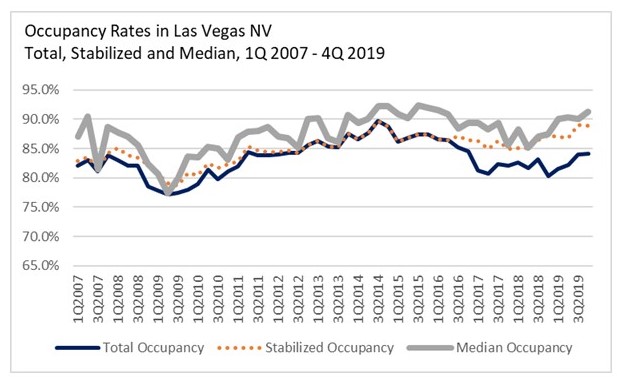
Las Vegas ranks 31st of the NIC MAP® 31 Primary Markets in size, with roughly 4,400 units situated in 36 properties. In the fourth quarter of 2019, it had a seniors housing occupancy rate of 84.1%, fourth lowest among the 31 markets (Phoenix, Atlanta and Houston were lower). Stabilized occupancy was considerably higher at 88.9%, pushing its rank to 20th among the Primary Markets, and Las Vegas’ median occupancy rate was even higher at 91.3%, giving it a rank of 18th among the Primary Markets. The wide disparity in occupancy rates reflects both the large number of units recently opened but that remain empty and some properties with very low occupancy rates that are dragging down the average.
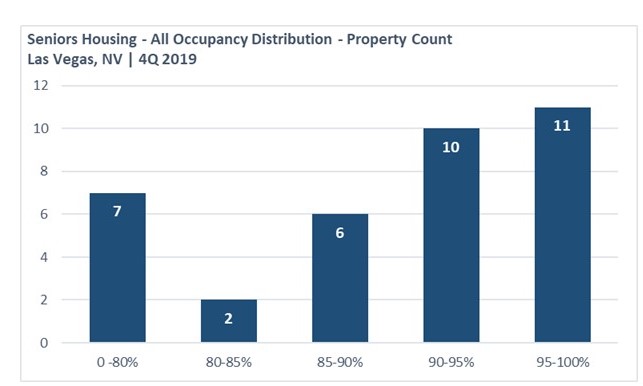
The distribution chart below highlights some of these points. In the fourth quarter of 2019, 11 of 36 Las Vegas properties had occupancy rates between 95% and 100% while 10 properties had occupancy rates between 90% and 95%; this helped pull the median occupancy higher. On the other end of the spectrum, 7 properties had occupancy rates less than 80%, which pulled the average lower. For benchmarking purposes, some investors and operators prefer to measure themselves against the median occupancy rate, assuming that the properties that support a higher median rate are of higher institutional quality.
It’s notable that the difference between the median occupancy rate and average occupancy rate is more than seven percentage points in Las Vegas, more than that of the nation and further underscoring the wide disparity in property performance in Las Vegas. In Las Vegas, it’s a tale of many properties with two distinctly different occupancy performances within the metropolitan market.
Occupancy Distribution Varies Widely Across Las Vegas
It’s also interesting to note that Las Vegas is a market that tends to have significant vacant inventory. Its average occupancy rate has only been 83.2% since NIC MAP began reporting the data. In contrast, the Primary Market average has been 89.0%. This is important in developing business plans or in establishing plans for development and may influence assumptions related to stabilized property occupancy rates for a property. Historical average stabilized occupancy rates were a bit higher at 84.8% for Las Vegas, which compares with 90.3% for the Primary Markets, and 87.4% for median occupancy, which compares with 92.5% for the Primary Markets.
4Q 2019 Median Occupancy in Las Vegas was More Than Seven Percentage Points Higher Than Total Average Occupancy
However, there is room for improvement in the occupancy trends, and some of that improvement is already evident today. Indeed, in the fourth quarter of 2019, the average occupancy rate in Las Vegas was 84.1%, stabilized occupancy was 88.9%, and median occupancy was 91.3% − all better than the historical long-term 14-year averages.
On the surface, Las Vegas is a market that an investor, operator or developer may shy away from. It ranks near the bottom of the pack for average occupancy rates from a historic perspective as well as from recent data. But digging deeper reveals some interesting observations regarding occupancy rates.
The stabilized occupancy rate in Las Vegas ranks higher than does the average occupancy rate, and the median occupancy rate ranks significantly higher than the average occupancy rate. The distribution of occupancy rate skews right and toward properties with higher occupancy rates.
Further, and not mentioned in this blog, is the fact that population growth is strong − more than double the national pace. And importantly, demographic data from NIC MAP’s Site Information Report shows robust growth in the 75-plus cohort through at least 2024. In addition, construction activity has recently stalled. Market penetration rates are low. Rent growth is relatively robust, especially for some properties. Some properties are hitting it out of the park, while others…well, less so.
This analysis suggests that further investigation into what factors create a successful property in Las Vegas may be in order.