“The market fundamentals in the Wave 26 Executive Insights survey data through mid-April show signals of headway. Leads volume is up and the shares of organizations reporting accelerations in move-ins continues to trend positively with each of the care segments reaching new high points in the survey time series. Exactly when these leading indicators will translate into higher occupancy rates being reported across the sector is yet to be seen.”
–Lana Peck, Senior Principal, NIC
NIC’s Executive Survey of operators in seniors housing and skilled nursing is designed to deliver transparency into market fundamentals in the seniors housing and care space as market conditions continue to change. This Wave 26 survey includes responses collected April 5 to April 18, 2021 from owners and executives of 81 small, medium, and large seniors housing and skilled nursing operators from across the nation, representing hundreds of properties and thousands of units across respondents’ portfolios of properties.
Detailed reports for each “wave” of the survey and a PDF of the report charts can be found on the NIC COVID-19 Resource Center webpage under Executive Survey Insights.
Wave 26 Summary of Insights and Findings
- According to Wave 26 seniors housing and care survey respondents, on average, nine out of ten residents (91%) of their respective properties—including all care segments across their portfolios—have been fully vaccinated for COVID-19. Having residents vaccinated has made a significant impact in opening communities. As stipulated by a variety of disparate state guidelines, many respondents commented that their organizations are now able to resume in-person tours, offer limited/socially distanced communal dining, and allow small indoor gatherings, worship services and larger gatherings outdoors. Others are now allowing family visitations in apartments and resuming off-site excursions of vaccinated residents. Many organizations indicate they continue to mandate mask wearing in community areas.
- Staff uptake of the vaccine, however, leveled off between Waves 22 and 24 and has just recently increased slightly from over half (55%) to nearly two-thirds of staff in survey Waves 25 and 26 (63% and 64%, respectively). As a result of the vaccination rates, one-half of organizations have been testing staff at least once a week for COVID-19 since the Wave 24 survey, but two-thirds are testing residents only if symptomatic (up from half in survey Waves 24 and 25).
- Aside from the need to test staff more frequently, and the costs associated with testing, one-half of respondent organizations indicate they probably will not or definitely will not make the COVID-19 vaccine mandatory for staff (52%); however, one-quarter probably will or definitely will (24%). The share of organizations that would consider making the vaccine mandatory for staff has remained steady since the Wave 23 survey conducted in late-February to early-March. A NIC blog post on April 15 reported that new cases among staff have fallen, but less so than for residents and that new cases for staff are 2.4 times higher than among residents, the highest rate since CMS started reporting data in late May. Whether mandatory COVID-19 vaccination for staff will grow among operators is yet to be seen.
- In the Wave 26 survey, respondents were asked if their organizations had seen an increase in resident lead volume since the beginning of the year—and if they had—is lead volume above pre-pandemic levels? As shown in the chart below, roughly four out of five organizations reported an increase in lead volume (84%). However, only one in five reported lead volume currently above pre-pandemic levels (20%).

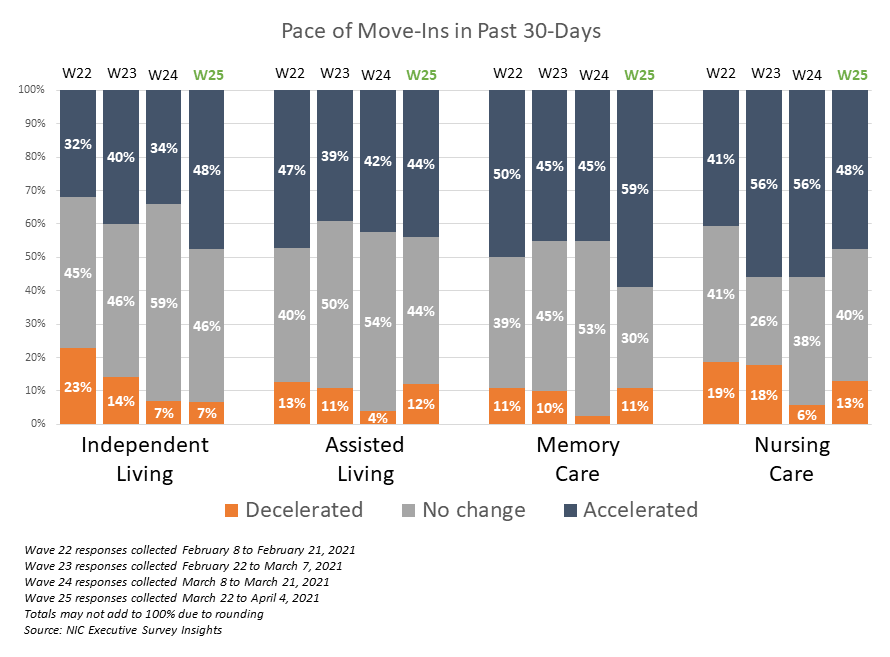
- The shares of organizations reporting acceleration in the pace of move-ins for each of the care segments set new high points in the time series. Between two-thirds and one-half of respondents note that the pace of move-ins accelerated in the past 30-days. Increased resident demand was cited by nine out of ten respondents (88%) as a reason for acceleration in move-ins. The majority of respondents report no change in the pace of move-outs for each of the care segments (74% to 91%).

- The Wave 26 survey data continue to show a trend in the shares of organizations reporting higher occupancy across all four care segments, and each of the care segments set new peaks in the time series. Between one-third and more than one-half of organizations reported upward changes in occupancy.

- The degrees of occupancy change vary. As referenced and shown in the chart above, occupancy increases in organizations with independent living residences peaked in survey Waves 25 and 26. As shown in the chart below however, while fewer reported occupancy declines, more reported no change in occupancy rates in Wave 26 (50% vs. 39%).
- In the face of historically low occupancy rates according to NIC MAP data in the first quarter of 2021 (record low of 78.8% seniors housing occupancy rate), on average, about 50% of respondents to the survey since July 20 indicated their organization was offering rent concessions. As of Wave 26, three out of five respondents (61%) with multiple properties in their portfolios are offering rent concessions in more than half to all of their properties.

- Most rent concessions included discounts and/or free rent for a specific amount of time (73% and 65%, respectively). Non-monetary and other benefits frequently mentioned by respondents included move-in assistance and/or covering all or a portion of the new resident’s moving expenses.

- Like prior waves of the survey, four out of five respondents to Wave 26 indicated their organization was experiencing staffing shortages in their properties. Of those respondents with multiple properties in their portfolios, 80% had staffing shortages in more than half to all of their properties.
- Staffing shortages that were experienced by many operators prior to and exacerbated by the pandemic persist. Nearly all respondents to the Wave 25 survey were paying staff overtime hours, and four out of five organizations were tapping agency/temp staff. In Wave 26, survey respondents described various strategies that operators are implementing to attract staff. As depicted in the word cloud below, most organizations commented that they are offering hiring/sign-on bonuses, bonuses for employees who refer new hires, and wage increases. Others are staging job fairs and recruiting events, offering flexible shifts/schedules, and enhancing benefit packages. This qualitative data will be quantified in the Wave 27 survey.

Wave 25 Survey Demographics
- Responses were collected between April 5 and April 18, 2021 from owners and executives of 81 seniors housing and skilled nursing operators from across the nation. Owner/operators with 1 to 10 properties comprise 60% of the sample. Operators with 11 to 25 and 26 properties or more make up 40% of the sample (19% and 21%, respectively).
- Roughly one-half of respondents are exclusively for-profit providers (48%), 43% are nonprofit providers, and 9% operate both for-profit and nonprofit seniors housing and care organizations.
- Many respondents in the sample report operating combinations of property types. Across their entire portfolios of properties, 71% of the organizations operate seniors housing properties (IL, AL, MC), 31% operate nursing care properties, and 40% operate CCRCs (aka Life Plan Communities).
Owners and C-suite executives of seniors housing and care properties, please help us tell an accurate story about our industry’s performance. Now, more than ever, we need your response so that we can track firsthand the inflection point on occupancy. This will be a turning point and we want all of our industry stakeholders to know when this important moment occurs.
The current survey is available and takes 5 minutes to complete. If you are an owner or C-suite executive of seniors housing and care and have not received an email invitation to take the survey, please click this link, which will take you there.
NIC wishes to thank survey respondents for their valuable input and continuing support for this effort to bring clarity and create a comprehensive and honest narrative in the seniors housing and care space at a time when trends are continuing to change in our sector.


