In last week’s NIC Notes, we shared three highlights from the October NIC MAP® Data Service webinar on key seniors housing data trends during the third quarter of 2019. Two additional key takeaways are detailed below.
Takeaway #1: Increase in seniors housing occupancy from an 8-year low.
Takeaway #2: Slight increase in assisted living occupancy.
Takeaway #3: Slowing of assisted living units under construction.
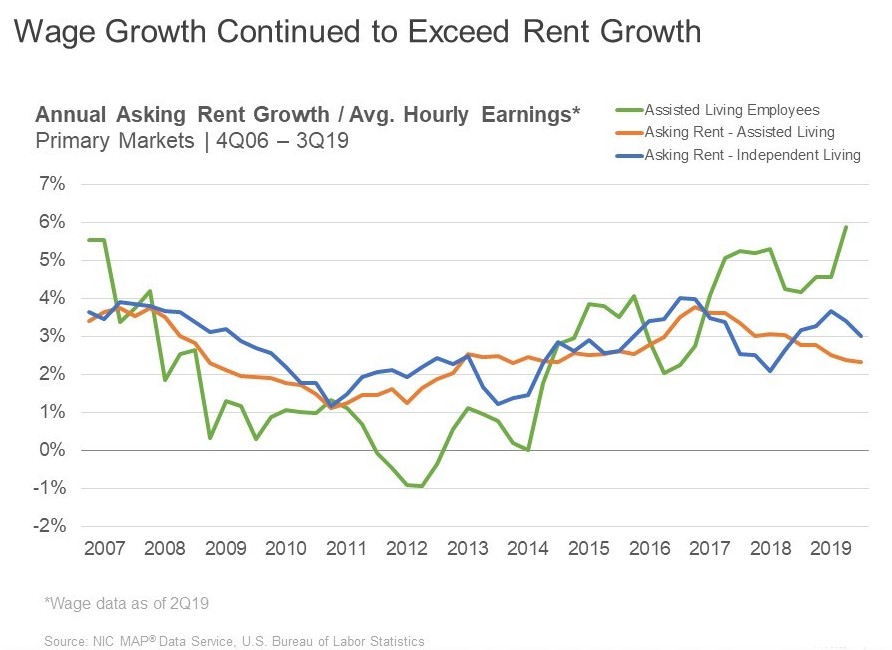
Takeaway #4: Wage growth continued to exceed rent growth.
- Since 2017, same-store asking rent growth for assisted living has been decelerating and this pattern continued in the third quarter when annual rent growth slipped back to 2.3% from 3.8% in late 2016, and from 2.8% one year ago. This can be seen on the orange line below.
- For independent living, the pattern is not as consistent and, in the third quarter, annual asking rent growth was 3.0%.
- Compared with the growth of average hourly earnings for assisted living in the second quarter, which increased by a very strong 5.9% from year-earlier levels, asking rent growth has been lagging. Based on anecdotal comments from operators, the BLS estimate of 5.9% seems to be more accurate than past readings of the upward pressure they have been experiencing for wage growth.
- For many operators, labor expenses amount to 60% of their expenses so this is taking a toll on their ability to maintain and grow NOI.

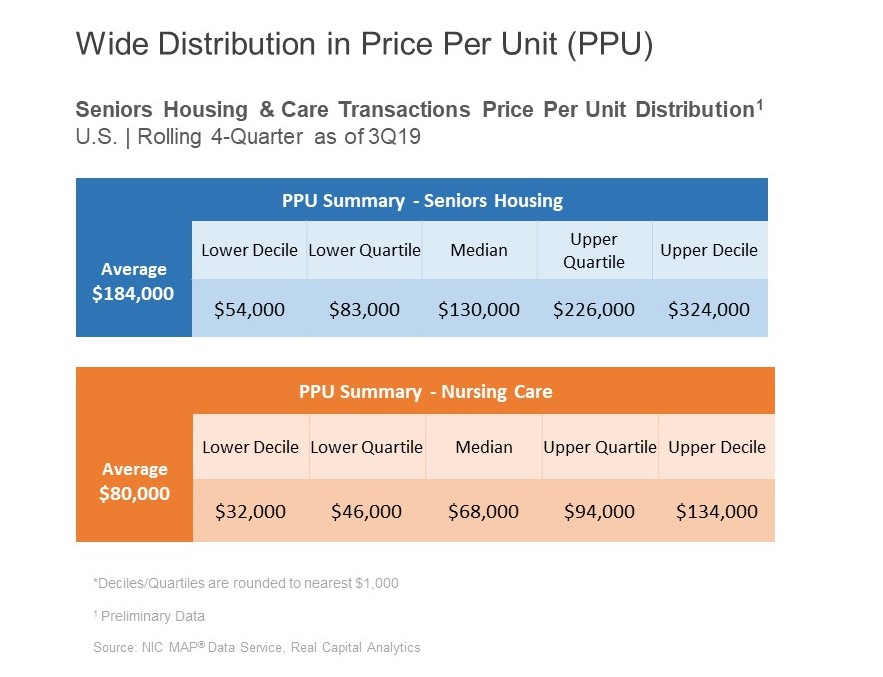
Key Takeaway #5: Wide distribution in price per unit (PPU).
- The chart below represents a snapshot of the pricing distribution of seniors housing and skilled nursing properties as of the third quarter of 2019.
- For perspective, the average price per unit for seniors housing was $184,000, which represents an increase of 9.2% from the second quarter when it came in at $168,500. Compared to a year ago, the price per unit increased 17%.
- There is a wide range of pricing, however, as this chart shows, with the upper decile at $324,000.
- For skilled nursing the upper decile is $200,000 lower at $134,000.

###