Skilled Nursing Occupancy Increased to 74.2% in June 2021

NIC MAP® Data Service powered by NIC MAP Vision released its latest Skilled Nursing Monthly Report which includes key monthly data points through June 2021. Here are key takeaways from the report.

Reimbursement differential between Medicare fee-for-service and managed Medicare has accelerated during the pandemic.

NIC MAP® Data Service, powered by NIC MAP Vision, released its latest Skilled Nursing Monthly Report on September 2, 2021, which includes key monthly data points from January 2012 through June 2021.

Here are some key takeaways from NIC Analytics regarding the data covered in the report:

The upward trend in skilled nursing occupancy continued in June. Occupancy increased for the fifth month in a row, rising 86 basis points from May to end June at 74.2%. Occupancy is now up 297 basis points from the 71.2% low point reached in January. There continues to be optimism, especially from investors, given the success of the vaccines but the second half of 2021 will be crucial in terms of the occupancy trend. The expectation is that admissions will continue to increase with rising demand and elective surgeries will continue to provide support for additional admissions to skilled nursing properties. However, occupancy still is very low relative to pre-pandemic levels and cash flow and liquidity is a concern at some properties. Occupancy is down 11.2 percentage points from the pre-pandemic February 2020 level of 85.4%. In addition, the Delta variant does pose a threat, especially in some states with lower vaccinated populations.

SNF Occupancy June 2021

Managed Medicare revenue per patient day (RPPD) held steady in June but is down 4.2% from last year in June 2020. The continued decline in managed Medicare revenue per patient day poses a challenge to skilled nursing operators as the reimbursement differential between Medicare fee-for-service and managed Medicare has accelerated during the pandemic. Medicare fee-for-service RPPD ended June 2021 at $560 and managed Medicare ended at $453, representing a $107 differential. Pre-pandemic, in February of 2020, the differential was $92. As managed Medicare continues to grow, operators and investors should pay attention to this trend and adjust accordingly.


1900x400_SN_landingGraphic_V5

{{cta(‘cded5c49-0152-4bb8-af91-66b8635614d2′,’justifycenter’)}}

Medicare revenue mix and RPPD continue to decline as fewer COVID-19 cases in properties have resulted in less need for utilizing the 3-Day rule waiver and per day reimbursement for COVD-19-positive patients. Medicare revenue mix ended June at 20.0% and is down from its pandemic high of 24.8% set in January 2021. Medicare RPPD is down 2.5% from its pandemic peak of $574 in June 2020. Meanwhile, managed Medicare revenue mix was essentially flat at 10.5%.  However, this is 240 basis points above the pandemic low of 8.1% set in May 2020.

SNF Revenue Mix June 2021-1

Medicaid patient day mix continued to increase, albeit slowly, ending June at 66.5%. It has increased 292 basis points from the pandemic low of 63.6% set in January 2021. Meanwhile, Medicaid revenue mix was flat from the prior month, ending June at 49.7%. One element of the Medicaid revenue share of a property’s revenue is RPPD and that has declined 1.4% since the pandemic high of $243 set in February 2021. RPPD has likely declined due to less reimbursement support from most states as COVID-19 cases within skilled nursing properties declined.


To get more trends from the latest data you can download the Skilled Nursing Monthly Report here. There is no charge for this report.

The report provides aggregate data at the national level from a sampling of skilled nursing operators with multiple properties in the United States. NIC continues to grow its database of participating operators in order to provide data at localized levels in the future. Operators who are interested in participating can complete a participation form at https://www.nic.org/skilled-nursing-data-initiative. NIC and NIC MAP Vision maintain strict confidentiality of all data received.


Interested in learning more about NIC MAP data? To learn more about NIC MAP data, powered by NIC MAP Vision, and about accessing the data featured in this article, schedule a meeting with a product expert today.

Disappointing August Employment Report: Jobs Up by 235,000

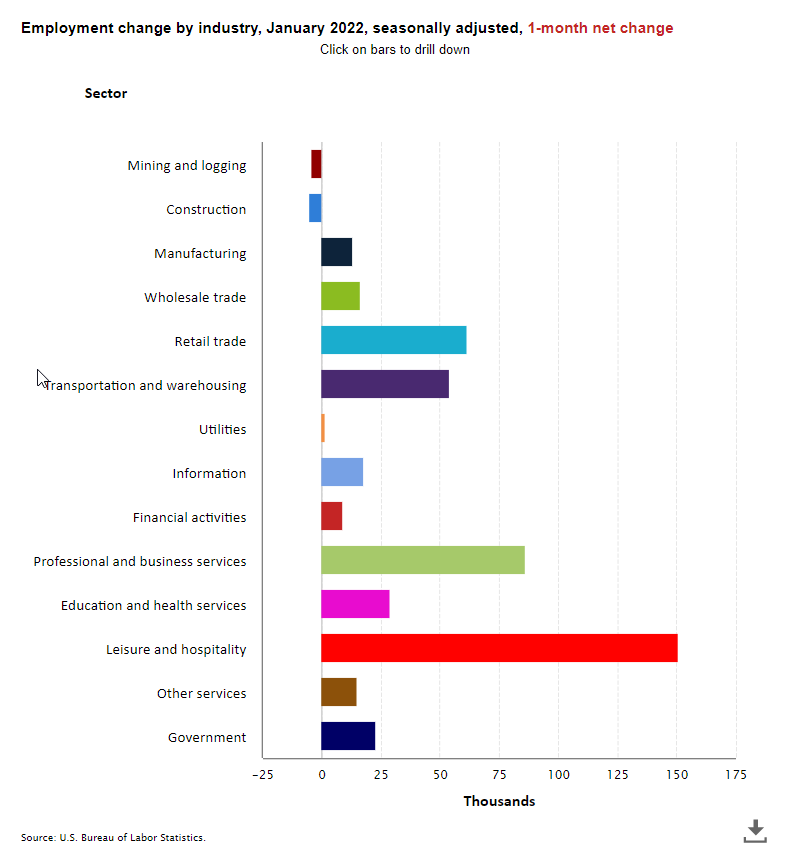
The Labor Department reported that nonfarm payrolls rose by a weaker than expected 235,000 in August 2021. The consensus had been for an increase of 725,000. This was a sharp deceleration from July when jobs grew by 1.1 million and June when jobs increased by 962,000. Through August, monthly job growth has averaged 586,00 per month.

The Labor Department reported that nonfarm payrolls rose by a weaker than expected 235,000 in August 2021. The consensus had been for an increase of 725,000. This was a sharp deceleration from July when jobs grew by 1.1 million and June when jobs increased by 962,000. Through August, monthly job growth has averaged 586,00 per month. Nonfarm payrolls are now up by 17.0 million since April 2020 but remain down by 5.3 million or 3.5% from pre-pandemic levels of February 2020.

The data show that the U.S. recovery from the pandemic continues but at a slower pace. The COVID-10 Delta variant may be weighing on the economy as evidenced by the limited growth in the high-contact leisure and hospitality sectors which had been expanding rapidly prior to August. Businesses may be holding off hiring and workers may be holding off taking jobs amid heightened fear of the Delta variant.

Today’s report is important as the Federal Reserve wants to see “substantial progress” in the economy before it shifts monetary policy and begins “tapering” when it will purchase fewer long-term securities for its balance sheet and before it starts to shift toward a higher interest rate regime. That said, Fed concerns about upward pressures on wages may have been exacerbated by the 4.3% annual increase in average hourly earnings.

Indeed, average hourly earnings for all employees on private nonfarm payrolls rose by $0.17 in August to $30.73, a gain of 4.3% from a year earlier and up from a revised 4.1% in July. August marked the fourth consecutive month of increases. The data suggests that rising demand for labor associated with the recovery from the pandemic is putting upward pressure on wages. That said, the Labor Department warns that the pandemic has affected the ability to fully interpret the wage data due to the wide swings in employment trends.

Job levels continued to contract for nursing care facilities which fell by 7,100 jobs to a seasonally adjusted 1,364,000 and were down from year-earlier levels of 1,464,600. Jobs also contracted for community care facilities for the elderly, falling by 2,600 to 887,200 and are down from 914,400 one year ago.

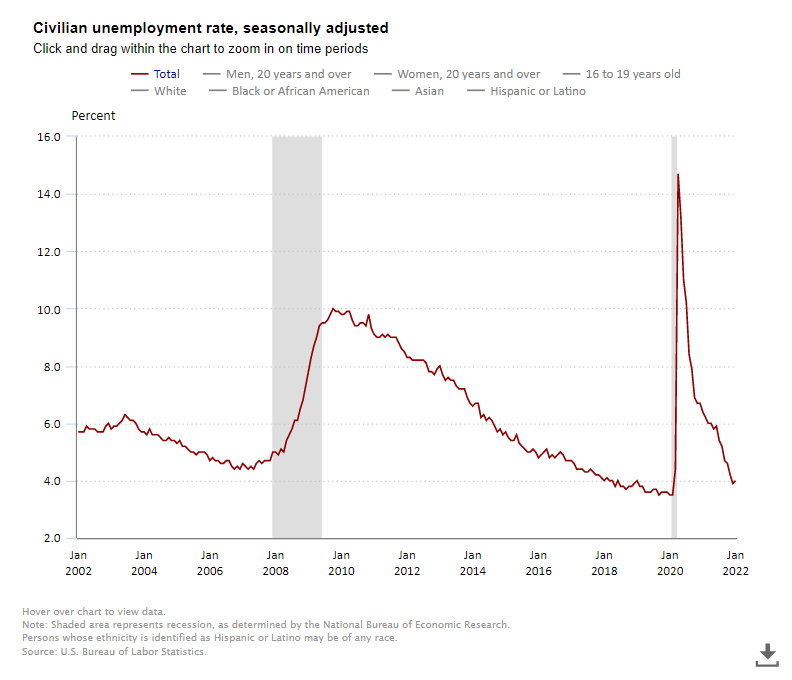
Separately and from a different survey, the Labor Department reported that the unemployment rate fell by 0.2 percentage points to 5.2% in August and the number of unemployed persons fell to 8.4 million, still higher than the 5.7 million persons prior to the pandemic. The jobless rate is now 1.6 percentage points above the pre-pandemic level of 3.5% seen in February 2020, but well below the 14.7% peak seen in April 2020. The underemployment rate or the U-6 jobless rate was 8.8% down from 9.2% in July 2021. This figure includes those who have quit looking for a job because they are discouraged about their prospects and people working part-time but desiring a full work week.

Among the major worker groups, the unemployment rates were lowest for Whites at 4.6%, adult women at 4.8% and adult men at 5.1%. The jobless rate was highest for teenagers at 11.2%, Blacks at 8.8%, Hispanics at 6.4%, and Asians at 4.6%.

The number of long-term unemployed (those jobless for 27 weeks or more) decreased by 246,000 to 3.2 million but is 2.1 million higher than in February 2020, suggesting that this continues to be a very challenging time for many Americans. Long-term unemployed persons account for 37.4% of the total number of unemployed persons.

The labor force participation rate, which is a measure of the share of working age people who are employed or looking for work was steady at 61.7% in August and has remained within a narrow range of 61.4% to 61.7% since June 2020. Many workers have dropped out of the labor force since the pandemic began to take care of family members or out of fear of working and catching the virus.

The change in total nonfarm payroll employment for June was revised up by 24,000 from a gain of 938,000 to 962,000 and the change for July was revised up by 110,000 from 943,000 to 1,053,000. With these revisions, employment in July and June combined is 134,000 higher than previously reported. Monthly revisions result from additional reports received from businesses and government agencies since the last published estimates and from the recalculation of seasonal factors.

2Q2021 NIC MAP Seniors Housing Actual Rates Report Key Takeaways

The NIC MAP® Data Service, powered by NIC MAP Vision, released national monthly data through June 2021 for actual rates and leasing velocity. This report includes national data as well as data for Atlanta, Philadelphia, and Phoenix. 

The NIC MAP® Data Service, powered by NIC MAP Vision, recently released national monthly data through June 2021 for actual rates and leasing velocity. This report includes national data as well as data for Atlanta, Philadelphia, and Phoenix. 

A few of the key takeaways from the 2Q2021 NIC MAP® Seniors Housing Actual Rates Report are listed below. These key takeaways are based on data included in the Segment Type report. Care segments refer to the levels of care and services provided to a resident living in an assisted living, memory care or independent living unit. Full access to the reports and other takeaways is available to NIC MAP Data Service clients.  

  • For all three care segments (independent living, assisted living, and memory care) move-ins outpaced move-outs for four consecutive months from March 2021 through June 2021, showing continued improvement.
    • Move-ins for the independent living and assisted living care segments reached their recorded highs in the time series in June 2021. Independent living reached 2.8% of inventory and assisted living reached 3.8% of inventory.
    • Move-ins for the memory care segments were also high in 2Q2021 at 4.4% of inventory in June 2021, down from the recorded high of 4.7% of inventory in March of 2021.
  • Move-outs slowed in 2Q2021. For the independent living segment, move-outs were at 1.9% of inventory in June 2021. The last time move-outs for independent living were as low as 1.9% was in January 2020. Move-outs for assisted living segments reached the recorded low in the time series of 2.8% in June 2021. Move-outs peaked at 3.7% in July 2020 during the pandemic. Move-outs for memory care segments were at 3.1% for both April and June of 2021, the lowest it has been since September 2018 when it was 3.1%. For memory care, move-outs peaked at 5.3% in July 2020.
  • Average initial rates for residents moving into independent living, assisted living and memory care segments were below average asking rates, with monthly spreads largest for memory care.

    • The average discount in initial rates for memory care units was 8.6% ($564) in June 2021, up from 6.1% one year earlier in June 2020. This discount of 8.6% equates to 1.0 month on an annualized basis, whereas 6.1% equated to 0.7 month.

    • It should be noted that some operators are providing concessions to incentivize move-ins rather than discounts. Examples of concessions could include a free TV upon move-in or a kitchen upgrade. These types of concessions would not be captured in the discounts reported here.

The Actual Rates Data Initiative is driven by the need to continually increase transparency in the seniors housing sector and achieve greater parity to data that is available in other real estate asset types. Now more than ever, with impacts of the COVID-19 pandemic on the sector, having access to accurate data on the actual monthly rates that a seniors housing resident pays as compared to property level asking rates helps the sector achieve this goal.

About the Report

The NIC MAP Seniors Housing Actual Rates Report provides aggregate national data from approximately 300,000 units within more than 2,600 properties across the U.S. operated by 25 to 30 seniors housing providers. The operators included in the current sample tend to be larger, professionally managed, and investment-grade operators as we currently require participating operators to manage 5 or more properties. Note that this monthly time series is comprised of end-of-month data for each respective month.

While these trends are certainly interesting aggregated across the states, actual rates data is even more useful at the metro level. NIC MAP Vision is continuing to work towards reporting more markets.

Interested in Participating?

The Actual Rates Data Initiative is an effort to expand seniors housing data and we are looking for operators who have five or more properties to participate. We have expertise in extracting data from industry leading software systems, such as Yardi, PointClickCare, Alis, and MatrixCare, and can facilitate the process for you.

Your organization benefits through:

  • More informed benchmarking, strategic planning, and day-to-day business operations,
  • Increased transparency, aligning with other commercial real estate assets in terms of data availability, and
  • Enhanced investment and efficiency across the sector.

Learn more by visiting nic.org/actual-rates.


Interested in learning more about NIC MAP data? 

To learn more about NIC MAP data, powered by NIC MAP Vision, and about accessing the data featured in this article, schedule a meeting with a product expert today. 

The Economic Outlook and Its Impact on the Industry

Two of the nation’s most influential economic thinkers, Paul Krugman and Lawrence H. Summers, will face-off in person at this year’s NIC Fall Conference during a lively main stage debate.

Two of the nation’s most influential economic thinkers, Paul Krugman and Lawrence H. Summers, will face-off in person at this year’s NIC Fall Conference during a lively main stage debate. Both have strong, often differing opinions about the economy and the path forward. The discussion will be moderated by Angela Mago, president Key Commercial Bank & KeyBank Real Estate Capital.

Krugman is a Nobel Prize winning economist and professor emeritus of Princeton University’s Woodrow Wilson School. Summers is the former Secretary of the U.S. Treasury and president of Harvard University, and served in many U.S. executive branch administrations.

To provide context for the upcoming discussion, NICs chief economist, Beth Mace, recaps the big issues driving the economy, and topics likely to be addressed at the upcoming Fall Conference session.

Growth Outlook

As of the second quarter, real GDP in the U.S. had surpassed its pre-pandemic level, rising at a fast 6.5% annualized clip. That said, growth is likely to be much slower in the coming months as the vast pandemic-related fiscal stimulus starts to wane, pent-up demand begins to fade, and as the COVID-19 Delta variant takes its toll. It will be interesting to hear the broad views Krugman and Summers will have on the shape of the post-pandemic recovery.

Inflation

Since the recovery from the pandemic has begun, inflation has increased due to supply chain disruptions and reopening effects. The policy question has become whether this inflation growth is transitory or will become more permanently embedded in consumer and business expectations.

Labor Pains: Short or Longer Term?

Increasingly, we hear from employers of all industries, and importantly, seniors housing and nursing care are among these industries, that finding workers is a limiting factor to business expansion. Certainly, one part of the discussion on labor shortages is around what is causing so many low wage workers to stay out of the labor force now.

Interest Rates

Federal Reserve Chairman Jerome Powell recently said that interest rate hikes are not on the Fed’s radar immediately. But the markets may not agree with the pace and timing of expected interest rates increases. As the economy starts to improve, what should we expect to see with interest rates?

Send Us Your Questions

For more on the 2021 NIC Fall Conference opening session with Krugman and Summers, look for an interview with Paul Krugman in the September edition of the NIC Insider newsletter, coming September 9. As session moderator Angela Mago prepares for the discussion, she wants to know what topics industry stakeholders want to hear about. Send your questions now to submityourquestions@nic.org.

Learn more about the 2021 NIC Fall Conference and register here


Enhanced Transparency with the New NIC Lending Trends Report

The NIC Lending Trends report provides Q1 2021 data plus five years of data of seniors housing and nursing care loan volumes and loan balances from debt providers.

The NIC Analytics team recently released the inaugural NIC Lending Trends report. The timely report provides first quarter 2021 data as well as nearly five years of data of senior housing and nursing care loan volumes and loan balances from a range of debt providers.

The new quarterly report currently tracks over $85 billion in senior housing and care loans including construction loans, mini-perm/bridge loans, and permanent loans. It includes delinquency rates, same-store growth metrics and indexed volumes.

NIC Analytics has been collecting data for more than five years with the goal of further enhancing transparency of capital market trends in the senior housing and care sector. These data are not to be interpreted as a census of all senior housing and skilled nursing lending activity in the U.S. but rather reflect lending activity from participants included in the survey sample only.

Highlights of the 1Q2021 report can be found below, with the full report available for download on nic.org. The next quarterly NIC Lending Trends Report, including second quarter 2021 data, is scheduled for release in early November.


Takeaways from 1Q21 NIC Lending Trends Report

  • The issuance of closed new construction loans remained relatively weak for senior housing in 1Q2021 and was at its lowest level since the data series has been reported starting in mid-2016. Growth was negative for the fourth consecutive quarter on a same-store quarter-over-quarter basis. Lenders’ interest in many development projects was put on hold due to uncertainties associated with the pandemic. Anecdotally, and since the introduction and widespread use of vaccinations at the end of 2020, lender interest in the sector has improved and data in future quarters may prove this out. For nursing care, the volume of new construction loans closed saw an increase in 1Q2021 from 4Q2020 but remains at very low levels and is in line with historic patterns.

Source: NIC Lending Trends Report, NIC Analytics

  • Volume of new mini-perm/bridge loans closed was strong for nursing care in 1Q2021, reaching the second highest recorded volume in the time series. Lending has been increasing since the second quarter of 2020 and remained near its 4Q2020 peak. New mini-perm/bridge loans closed for senior housing were flat in 1Q2021 at relatively low levels compared with recent years.
  • New permanent loan issuance for senior housing was weak in 1Q2021 and was at its lowest level in the recorded time series since mid-2016. New permanent loans for senior housing saw a drop of 45.6% on a same-store basis from 4Q2020. Nursing care permanent loan issuance was also weak and has been so for the past several quarters.

Quarterly updates to the NIC Lending Trends Report will be available on nic.org. 

Interested in participating? NIC very much appreciates our data contributors. This report would not be possible without them. If you would like to participate and contribute your data, please email us at analytics@nic.org. The information provided as part of the Lending Trends survey will be kept strictly confidential. Data acquired from this survey will only be reported in the aggregate, and therefore, the resulting aggregated data will not be attributed to you or your company upon distribution. As a thank you for providing data, data contributors receive the Lending Trends report in advance of public publication.