Executive Survey Insights | June 2023

June 2023 ESI asked respondents to identify the share of full-time positions across their organization that are currently open- responses indicate there has been improvement

“The June 2023 ESI again asked respondents to identify the share of full-time positions across their organization that are currently open. The responses indicate an improvement in the number of open positions that are impacting communities.
In April 2023, only 5% of organizations reported having between 0% and 5% of full-time positions open. In June 2023, 20% or one-fifth of owners and operators report having the same lowest range of openings across full-time positions. This represents a four-fold increase over the past two months in the number of organizations reporting the lowest range for vacancies in full-time positions.
 

As staffing challenges can limit the number of new residents a community can intake, the anticipated occupancy recovery timeframes of respondent organizations are noteworthy. Almost half of respondents indicate that occupancy in their independent living (47%) and nursing care segments (44%) have returned to pre-pandemic levels, with approximately one-third of their memory care (37%) and assisted living care segments (30%) having returned to pre-pandemic occupancy levels.” 

–Ryan Brooks, Senior Principal, NIC 

This Executive Survey Insights (ESI) survey includes responses from June 1 to July 5, 2023, from owners and executives of 39 small, medium, and large senior housing and skilled nursing operators across the nation, representing hundreds of buildings and thousands of units across respondents’ portfolios of properties. More detailed reports for each “wave” of the survey and a PDF of the report charts can be found on the NIC COVID-19 Resource Center webpage under Executive Survey Insights 

Questions in the June 2023 ESI focus on the current staffing and labor environment, including the scope of staffing shortages and the driving factors behind them, the share of full-time open positions across respondent organizations, and expectations on when staffing challenges will improve. Responses across a number of these staffing and labor related questions – including whether or not an organization is experiencing a staffing shortage and the current share of full-time, open positions – indicate improvements are being realized.   Staffing Shortage Pie Chart, left pie chart indicates 82% are shortstaffed, right pie chart indicates what percent of properties across portfolio are experiencing a staffing shortage, with 44% responding 'up to 50% of our properties', 33% responding 'up to 25%', 11% responding more than 50%, and remaining 11% responding 'all of our properties


For the surveys of the prior 18 months, between 90% and 99% of organizations consistently reported experiencing a staffing shortage within their organization. In June 2023, four-fifths of organizations (82%) report a staffing shortage at their organization. While this represents a considerable portion of senior housing and care communities undergoing a staffing shortage, seeing improvement in this metric is noteworthy.  

Of organizations experiencing a staffing shortage, one-third of respondents (33%) are experiencing the shortage in up to 25% of their properties and two-fifths (44%) are experiencing the shortage in 26% to 50% of their properties. One-tenth of respondents are experiencing a staffing shortage in more than half of their properties and another one-tenth are experiencing a staffing shortage across all of their properties. 

When asked about the two top factors driving the existing staffing shortages, an inability to hire nurses was cited by almost half of respondents (48%), followed by an inability to hire nursing aide positions (42%), wage competition (35%), and staff turnover rates (29%). 

 Reason for Staffing Shortage, ranked at number 1 with 48% of respondents claiming 'inability to hire nurses, with 42% 'inability to fill nursing aide positions, 35% wage competition, 29% staff turnover rates, 26% individual market conditions, 13% competition from staffing agencies, 3% competition from other industries 

The June 2023 ESI again asked respondents to identify the share of full-time positions across their organization that are currently open. Responses indicate there has been improvement in the number of open positions that are impacting communities. In April 2023, only 5% of organizations reported having between 0% and 5% of full-time positions open. In June 2023, 20% or one-fifth of owners and operators report having the same lowest range of openings across full-time positions. This represents a four-fold increase over the past two months in the number of organizations reporting the lowest range for vacancies in full-time positions. 

 Current Share of Full-Time Open Positions comparison from April 2023 to June 2023, the responses indicate there has been improvement in the number of open positions that are impacting communities.


Conversely, in April 2023, one-fifth of respondents (19%) reported their range of open full-time positions to be greater than 20%. In June 2023, the proportion of respondents reporting vacancies within that range decreased to only one-tenth. 

Additionally, staffing and labor related issues are still cited as challenges, but not as the issues that are currently garnering the most focus and attention. For the second month in a row, rising operator expenses is the most-cited challenge facing respondent organizations (72%). Attracting community and caregiving staff (64%) and staff turnover (59%) are the second and third most cited challenges that organizations are currently facing.  

There also is some optimism expressed around the tempering of the staffing challenges that do remain. When asked when their organization anticipates staffing challenges will improve, almost one-half (44%) anticipate there will be improvement in the remaining six months of 2023. One-sixth of respondents (15%) anticipate improvement in the first half of 2024, and one-quarter (26%) anticipate improvement will come in the second half of 2024. The remaining one-sixth of respondents (16%) expect improvements in staffing challenges to take until 2025 or later.  

Anticipated Staffing Challenges pie chart with 44% claiming second half of 2023 and 26% claiming second half of 2024 

As staffing challenges can limit the number of new residents a community can intake, the anticipated occupancy recovery timeframes of respondent organizations are noteworthy. Almost half of respondents indicate that their independent living (47%) and nursing care segments (44%) indicate their occupancy have returned to pre-pandemic levels, with approximately one-third of their memory care (37%) and assisted living care segments (30%) having returned to pre-pandemic occupancy levels.  

While sizable shares of communities within each care segment have already seen their occupancies recover to pre-pandemic levels, another 20% to 30% of owners and operators across all care segments expect the recovery to take place during the remaining months of 2023. Only a small portion of respondent organizations – between 6% and 11% — anticipate occupancy recovery will take until 2025 or beyond to be realized. 

Anticipated Occupancy Recovery bar graph by care segment broken down by care segment, conveying that sizable shares of communities have already seen occupancies recover to pre-pandemic levels 

June 2023 Survey Demographics 

  • Responses were collected between June 1 and July 5, 2023, from owners and executives of 39 senior housing and skilled nursing operators across the nation. 
  • Owners/operators with 1 to 10 properties comprise just under two-thirds of the sample (62%). Operators with 11 to 25 properties account for roughly one-quarter (23%) and operators with 26 properties or more account for roughly one-sixth (15%) of respondents.  
  • More than one-half of respondents are exclusively for-profit providers (54%), two-fifths operate not-for-profit seniors housing and care properties (41%), and 5% operate both.   
  • Many respondents in the sample report operating combinations of property types. Across their entire portfolios of properties, three-quarters (72%) of the organizations operate seniors housing properties (IL, AL, MC), one-sixth (15%) operate nursing care properties, and one-third (33%) operate CCRCs – also known as life plan communities. 

The July 2023 ESI survey is currently open and will be collecting responses through July 31, 2023. If you are an owner or C-suite executive of seniors housing and care and would like an invitation to participate in the survey, please contact Ryan Brooks at rbrooks@nic.org to be added to the list of recipients. 

NIC wishes to extend a heartfelt thank you to the owners and operators who have contributed to this survey over the past three years. It is remarkable that we have now completed more than 50 waves of surveys. We have surveyed through numerous challenges — COVID-19, threats of a looming recession, labor shortages, inflation, and rising expenses — many of which still persist. As we continue to navigate through these challenges, your input and real-time insights help ensure the narrative on the senior housing and care sector is timely and accurate.  

Special Note on Nursing Care Response Rates: Lower respondent numbers for nursing care communities precludes NIC from highlighting those specific results in our ESI summaries. It is our hope that these survey findings are utilized to bring insights and an improved understanding of current market conditions for each care segment. As such, if you are an owner or operator of nursing care communities, your participation in the ESI surveys is strongly encouraged. Please also feel welcome to invite other nursing care operators to participate by sharing the anonymous survey link or reaching out to Ryan Brooks at rbrooks@nic.org to have them added to the ESI distribution list. Remember, by demonstrating transparency, together we build trust. Thank you!

New Metric: Absorption-to-Inventory-Growth Ratio for Senior Housing Reached New High in 2Q 2023

According to 2nd quarter 2023 NIC MAP® data, senior housing demand, as measured by the change in occupied units, continued to outpace new supply.

Strong Demand Has Provided a Stable Foundation for Senior Housing Occupancy Recovery. 

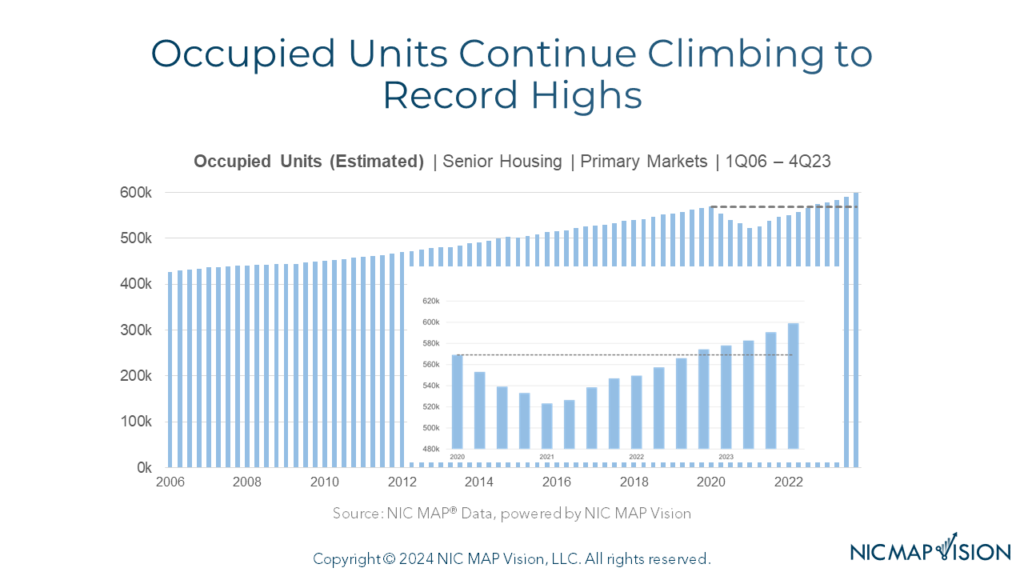
According to second quarter 2023 NIC MAP® data, released by NIC MAP Vision, senior housing demand, as measured by the change in occupied units, continued to outpace new supply, marking its ninth consecutive quarter of growth with a net
absorption gain for the NIC MAP Primary Markets of 5,092 units or 0.9% from the prior quarter and 25,803 units or 4.6% from year-earlier levels. Senior housing occupied stock is now 2.6% or 15,026 units above the pre-pandemic 1Q 2020 level. 
 

The strong demand for senior housing has been a significant driving force behind its ongoing occupancy recovery. With the population of older adults on the rise, there is a growing need for quality senior housing options. This consistent and growing demand has provided a stable foundation for many senior housing properties, helping to mitigate the impact on operators of economic fluctuations, rising expenses, and challenging capital market conditions. 

Limited Construction Activity and Moderate Inventory Growth Have Assisted the Senior Housing Occupancy Recovery 

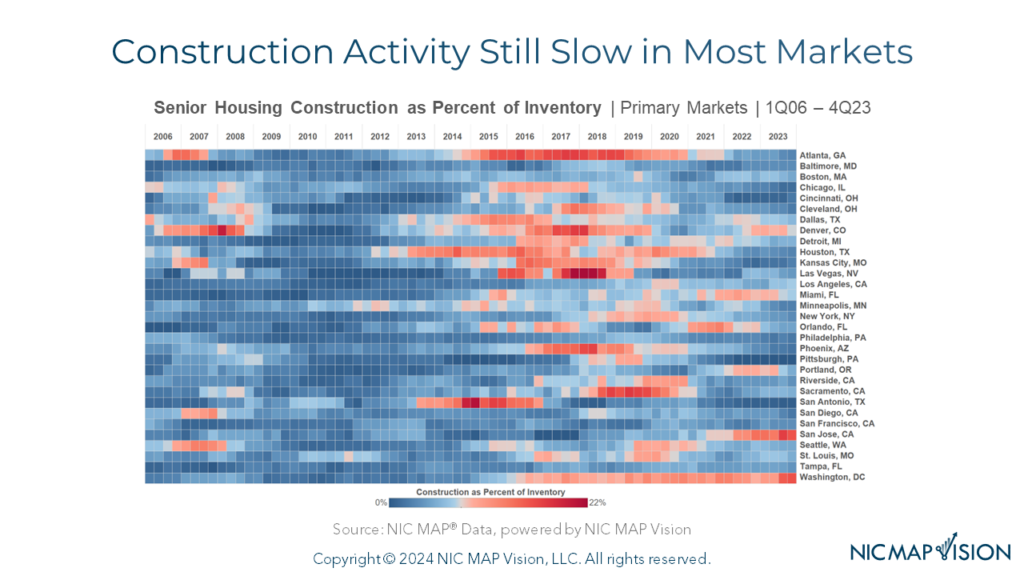
The continued recovery of senior housing occupancy has also been positively influenced by the moderate inventory growth that has resulted from fewer construction starts. In the second quarter of 2023, the inventory of senior housing properties in the NIC MAP Primary Markets increased by just 0.2% or 1,128 units from the prior quarter and 1.3% or 8,797 units from year-earlier levels. These were the smallest inventory increases in the last decade. Additionally, within the NIC MAP Primary Markets, construction starts continued to be limited compared with pre-pandemic levels. Notably, over the four-quarter period ending in the second quarter of 2023, senior housing starts totaled 11,673 units, marking a level not seen since 2012 and representing less than half of the starts reported during the four quarters of 2019. 

A New Metric to Depict Strong Demand and Moderate New Supply: The Absorption-to-Inventory-Growth (AIG) Ratio. 

To add perspective on demand and supply changes, NIC Analytics has created a new concept to consider. This measure offers a nuanced perspective on the balance between demand and supply. Called the absorption-to-inventory-growth ratio, this metric is calculated by dividing the number of newly occupied units within a given time period by the number of new units added to the market inventory during the same period. The ratio serves as an indicator of how effectively the market absorbs the newly supplied units. A higher positive ratio suggests stronger demand relative to the inventory growth, indicating a healthier balanced market, a lower positive ratio may indicate slower absorption of new units, potentially signaling an oversupplied market or weaker demand. Conversely, a negative ratio may indicate negative demand.  

The exhibit below depicts the senior housing absorption-to-inventory growth ratio for the NIC MAP Primary Markets since 2006. In the second quarter of 2023, for every 10 new senior housing units added, there has been a net absorption of 45 units, the highest absorption-to-inventory-growth ratio (+45:10) since NIC MAP Vision began reporting the data in 2005. This indicates a strong demand for senior housing, as the market has been able to absorb a significantly higher number of units than were added during the second quarter of 2023.  

The exhibit depicts the senior housing absorption-to-inventory growth ratio for the NIC MAP Primary Markets since 2006. In the second quarter of 2023, for every 10 new senior housing units added, there has been a net absorption of 45 units, the highest absorption-to-inventory-growth ratio since NIC MAP Vision began reporting.  Chart also depicts  2Q of 2020, having ratio of -38:10. 

In the second quarter of 2020, the height of the pandemic, this ratio was -38:10; in other words, for every 10 new senior housing units added, 38 units had been placed back in the market. 

From the second quarter of 2006 to the second quarter of 2023, the senior housing market experienced negative absorption in just six quarters. These quarters include the first quarter of 2009, the first quarter of 2015, and four consecutive quarters during the pandemic from the second quarter of 2020 to the first quarter of 2021. 

Occupancy has Increased for Two Years Straight, but Still has Room Before Reaching Pre-Pandemic Levels. 

As a result of this trend of positive demand coupled with a moderate pace of new supply and reflected in the recently strong absorption-to-inventory-growth ratios, the senior housing all-occupancy rate for the NIC MAP Primary Markets increased for the eighth consecutive quarter to 83.7% in the second quarter 2023, up 0.6 percentage points (pps) from the prior quarter. From its time series low of 77.8% in second quarter 2021, occupancy increased by 5.9pps but remained 3.4pps below pre-pandemic first quarter 2020 levels of 87.1%.  

By majority property type. At 85.4%, the all-occupancy rate for majority independent living (IL) properties for the NIC MAP Primary Markets increased by 0.3pps from the first quarter 2023. For majority assisted living properties (AL), the all-occupancy rate for the NIC MAP Primary Markets was up 0.8pps to 82.0% in the second quarter 2023. 

The senior housing market continues to experience a trend of higher acuity. Occupancy for assisted living continued to recover relatively faster than independent living. From its pandemic-related low, occupancy for assisted living increased by 8.1pps, more than twice the increase for independent living (up 3.8pps since second quarter 2021). However, occupancy for both independent living properties and assisted living properties remained 4.2pps and 2.5pps below their respective first quarter 2020 levels. 

As background, assisted living occupancy for the NIC MAP Secondary Markets, currently at 83.6%, is only 0.6pps to fully recover and return to first quarter 2020 levels (84.2%).  

Occupancy Recovery Across the 31 NIC MAP Primary Markets.  

In 14 of the 31 NIC MAP Primary Markets, assisted living occupancy rates have either returned to pre-pandemic first quarter 2020 levels or exceeded them, with some markets being within less than 1pps from returning to their first quarter 2020 levels. Notable examples include Phoenix, where occupancy stands at 82.1%, surpassing the first quarter 2020 level by 1.6pps, and Kansas City, with occupancy at 85.9%, exceeding the first quarter 2020 level by 2.4pps. Other markets such as Orlando, Denver, Detroit, Tampa, Cleveland, Cincinnati, Dallas, Miami, Atlanta, San Antonio, and Portland have also demonstrated notable recovery in assisted living occupancy rates.  

For independent living, out of the 31 NIC MAP Primary Markets, only five have returned/exceeded first quarter 2020 occupancy levels or are within less than 1pps of reaching that benchmark. Some of these markets include Riverside (85.3%, 1.7pps above first quarter 2020 level), and San Antonio (86.5%, 1.3pps above first quarter 2020 level).  

In conclusion, the recovery of senior housing occupancy can be attributed to a combination of factors, including demand-side and supply-side measures as well as the combination of both measures as reflected in the absorption-to-inventory-growth ratio. The consistent and growing demand, coupled with moderate levels of new supply, has played a role in this recovery. However, it is important to acknowledge that occupancy rates for senior housing across different markets and properties still have room for further improvement before reaching recovery to pre-pandemic levels. 

In future blogs, NIC Analytics will conduct an in-depth exploration of the absorption-to-inventory-growth (AIG) ratio to uncover insights into the dynamics of various markets, understand the efficiency of new unit absorption, and how supply and demand factors interact in shaping market conditions. 

Keep track of the timely review of the sector’s market fundamentals and trends. The NIC Intra-Quarterly Snapshot monthly publication, available for complimentary download on our website, continues to provide a powerful and closely watched means to stay ahead of industry trends. 

The July 2023 Intra-Quarterly Snapshot report will be released on our website on Thursday, August 10, 2023, at 4:30 p.m.   

Interested in learning more about NIC MAP Intra-Quarterly data? To learn more about NIC MAP Vision data, schedule a meeting with a product expert today.  

Skilled Nursing Occupancy Increased Slightly in April 2023

NIC MAP Vision released its latest Skilled Nursing Monthly Report on June 29, 2023. The report includes key monthly data points through April 2023.

NIC MAP Vision released its latest Skilled Nursing Monthly Report on June 29, 2023. The report includes key monthly data points from January 2012 through April 2023.

Here are some key takeaways from the report.

Occupancy

Skilled nursing occupancy increased in April after declining in March. It increased 9 basis points from March to end the month at 81.0%. However, occupancy has been down slightly since the beginning of the year (2023) in January. There was positive momentum in occupancy throughout 2022 and it is up 632 basis points since the low point (74.7%) reached in January 2021. Although occupancy was relatively flat from May 2022 through September 2022, it did increase 277 basis points from January 2022 to January 2023. The staffing crisis in the sector is still a significant burden on skilled nursing operators, especially as the acuity level of patients has increased along with the demand for nurses. As staffing, wage growth, and general inflation pressures persist, operations for many operators will be under pressure but the long-term demand for skilled nursing services is expected to grow over time.

Skilled Nursing Occupancy April 2023

Medicaid

Medicaid revenue mix increased, ending April at 50.4%. However, it is down 127 basis points from one year ago when it was 51.6% in April 2022. One element of the Medicaid revenue share of a property’s revenue is revenue per patient day (RPPD) and that was up slightly from March. It is up 3.0% since last year in April 2022 and is now at $270. Medicaid reimbursement has increased more than usual as many states embraced measures to increase reimbursement related to the number of COVID-19 cases throughout the pandemic, but many states have continued to increase reimbursement. Medicaid has increased 6.3% since February 2020. On the other hand, covering the cost of care for Medicaid patients is still a major concern as reimbursement does not cover the cost of care in many states. In addition, nursing home wage growth is elevated along with overall inflation, and staffing shortages are still a significant challenge in many areas of the country.

Medicare

Medicare revenue per patient day (RPPD) decreased slightly from March to end April at $587. This was a 0.69% decrease from its recent high of $591 in December 2022, which was its highest level since June 2020 when the federal government began implementing many initiatives to aid operators of properties for cases of COVID-19, including increases in Medicare fee-for-service reimbursements to help care for COVID-19 positive patients requiring additional care. Medicare RPPD is up 1.77% from one year ago in April 2022 and some of that increase can be attributed to the fiscal increase for 2022-2023. Meanwhile, Medicare revenue mix trended down in the month of April, decreasing 41 basis points from 22.0% to end the month at 21.6%. It is up 102 basis points compared to one year ago in April 2022. However, it is down 306 basis points from February 2022 which was when the country had an elevated number of COVID-19 cases, and the data suggests there was a significant uptick in the utilization of the 3-Day Rule waiver as COVID-19 cases increased last year. The 3-Day Rule waiver was implemented by Centers for Medicare and Medicaid Services (CMS) to eliminate the need to transfer positive COVID-19 patients back to the hospital to qualify for a Medicare paid skilled nursing stay, hence increasing the Medicare census at properties. As the cases decline, the Medicare revenue share declines, all else equal.

Managed Care

Managed Medicare revenue mix decreased 9 basis points from March to end April at 11.2%. This is up 202 basis points from the pandemic low set in May 2020 of 9.2%, which was a time when elective surgeries were suspended and created less referrals from hospital to skilled nursing properties. Meanwhile, Managed Medicare revenue per patient day (RPPD) decreased from $482 to $481 in April. Compared to its year-earlier value of $484, it is down 0.7% and it is down $121 (20.1%) from January 2012. It continues to create pressure on operators’ revenue as managed Medicare enrollment continues to expand its reach and coverage around the country. However, some operators see an opportunity to capture patient volume with the growth of managed care. The persistent decline in managed Medicare revenue per patient day continues to result in an expanded reimbursement differential between Medicare fee-for-service and managed Medicare. Medicare fee-for-service RPPD ended April 2023 at $587, representing a $107 difference. For context, the differential one year ago was $93 and two years ago it was $85.

Get more trends from the latest data by downloading the Skilled Nursing Monthly Report. There is no charge for this report. 

The report provides aggregate data at the national level from a sampling of skilled nursing operators with multiple properties in the United States. NIC continues to grow its database of participating operators to provide data at localized levels in the future. Operators who are interested in participating can complete a participation form on our website. NIC and NIC MAP Vision maintain strict confidentiality of all data received.


CCRC Performance 1Q 2023: A Deep Dive into Entrance Fee vs. Rental CCRCs

Analysis of occupancy and changes in inventory & asking rent growth by care segment—within entrance fee CCRCs and rental CCRCs in the NIC MAP Markets.

The following analysis examines occupancy and year-over-year changes in inventory, and same-store asking rent growth—by care segment—within entrance fee CCRCs and rental CCRCs in the 99 combined NIC MAP Primary and Secondary Markets. The analysis also explores the recovery of regional occupancy rates by payment type (entrance fee CCRCs vs. rental CCRCs) as well as the distribution of occupancy rates by payment type across all care segments during the first quarter of 2023.

NIC MAP®, powered by NIC MAP Vision, collects primary data on occupancy, asking rents, demand, inventory, and construction for more than 16,100 independent living, assisted living, memory care, skilled nursing, and continuing care retirement communities (CCRCs—also referred to as life plan communities) across 140 U.S. metropolitan markets. The dataset includes about 1,160 not-for-profit and for-profit entrance fee and rental CCRCs in these 140 combined markets, including 1,078 in the 99 combined Primary and Secondary Markets.

Occupancy Trends – Entrance Fee CCRCs Lead the Way and Surge Ahead of Competition

Entrance fee CCRCs have consistently outperformed rental CCRCs and non-CCRCs since NIC MAP Vision began reporting data in 2005. In the 99 NIC MAP Primary and Secondary markets, the occupancy rate for entrance fee CCRCs stood at 89.3% in the first quarter 2023, 4.9 percentage points (pps) higher than rental CCRCs (84.4%) and 7.7pps higher than non-CCRCs (81.6%).

Notably, the difference in occupancy rates between entrance fee CCRCs and rental CCRCs/non-CCRCs has been increasing since at least 2015 as the exhibit below shows, and this gap was amplified during the height of the pandemic. In fact, the occupancy differences between entrance fee CCRCs and non-CCRCs reached double digits in 2020 and 2021, with entrance fee CCRCs experiencing a relatively smaller decline in occupancy compared to non-CCRCs and rental CCRCs.

Generally, the success equation for CCRCs includes the profiles and characteristics of both residents and staff as principal components.

Residents of CCRCs are typically “life planners” and have set upon this life choice carefully and with considerable savings. The unique model of care in CCRCs often attracts younger residents with fewer health concerns and allows them to move through the continuum of care more seamlessly as acuity increases. Residents of CCRCs tend to have fewer serious health conditions upon move in and have passed medical screenings prior to admission. This likely leads to longer length of stay and greater overall retention.

From a workforce perspective, CCRCs often address staffing shortages by leveraging their ability to employ/assign workers across various levels of care, in order to fill staffing gaps. This staffing strategy can lead to improved resident experience and consistent quality of care, while also promoting a sense of community for both residents and staff.

Additionally, entrance fee CCRCs tend to offer financial structure and stability to residents, and residents of entrance fee CCRCs tend to have more financial resources, mainly due to the screening of financial conditions prior to admission. This can also lead to greater resident retention.

Further, operators of entrance fee CCRCs often have greater access to capital compared to rental CCRCs due to substantial upfront revenue generated from entrance fees, often financed through the sale of residents’ homes, and typically have access to different financing options. 

E1-CCRC


Recovery of Regional Occupancy Rates by Payment Type – Entrance Fee CCRCs vs. Rental CCRCs

In the first quarter of 2023, entrance fee CCRCs maintained higher occupancy rates than rental CCRCs across all regions. The largest differences in occupancy between entrance fee and rental were reported for the West North Central region, where entrance fee CCRC occupancy was 7.2 percentage points higher than rental, followed by the Mountain (5.6 percentage points), and the Southeast (5.4 percentage points).

Strong Occupancy Rates in Mid-Atlantic, Northeast, and Pacific. The Mid-Atlantic, Northeast, and Pacific regions had the strongest occupancy rates for both entrance fee and rental CCRCs in the first quarter of 2023. The occupancy rates within these regions with respect to payment type were above the average occupancy rate for entrance fee CCRCs (89.3%) and rental CCRCs (84.4%) in the combined 99 NIC MAP Primary and Secondary Markets.

Mid-Atlantic and Southwest Regions Closest to Recovery. For entrance fee CCRCs, the Southwest and Mid-Atlantic regions are the closest to fully recovering and returning to the occupancy levels of the first quarter 2020. The Southwest region has reached 86.0% occupancy, while the Mid-Atlantic regions is at 91.1%. Both regions are within 1.4pps and 2.2pps, respectively, of reaching pre-pandemic first quarter 2020 levels. As for rental CCRCs, the Southwest region (84.3%) has fully recovered and returned to the occupancy level of the first quarter 2020.

1Q 2023 Market Fundamentals by Care Segment – Entrance Fee CCRCs vs. Rental CCRCs

The exhibit below illustrates the relative market performance of entrance fee CCRCs compared with rental CCRCs by care segment in the first quarter of 2023 and includes year-over-year changes in occupancy, inventory, and asking rent growth.

Occupancy. Overall, the occupancy rate for entrance fee CCRCs continued to outpace that of rental CCRCs across all care segments. The difference in the first quarter 2023 occupancy rates between entrance fee CCRCs and rental CCRCs was largest for the memory care segment (4.8pps) and the independent living segment (4.2pps), and smallest for the nursing care segment (2.0pps).

The entrance fee CCRC independent living care segment had the highest occupancy (91.1%) in the first quarter of 2023, followed by entrance fee CCRC assisted living and memory care segments (88.0% and 87.7%, respectively).

In terms of occupancy improvements from one year ago, the largest occupancy gains for both entrance fee CCRCs and rental CCRCs were seen across nursing care segments (4.1pps and 3.6pps, respectively) -partly due to supply dynamics (negative inventory growth), while the smallest gains were seen across independent living segments (0.9pps and 1.8pps, respectively).

Asking Rent. The monthly average asking rent for entrance fee CCRCs across all care segments remained higher than rental CCRCs. The highest year-over-year asking rent growth for entrance fee CCRCs was noted in the assisted living segment (4.4% to $7,106). For rental CCRCs, the largest year-over-year asking rent growth was noted in the independent living segment (5.0% to $3,450). Overall, year-over-year asking rent growth across all care segments and payment types was around 4% in the first quarter 2023.

Note, these figures are for asking rates and do not consider any discounting that may be occurring.

Inventory. From year-earlier levels, nursing care inventory for both entrance fee and rental CCRCs experienced the largest declines (negative 3.4% and 2.7%, respectively). The highest year-over-year inventory growth was reported for the entrance fee CCRC independent living segments (0.5%) and rental CCRC memory care segments (0.3%).

Negative inventory growth can occur when units/beds are temporarily or permanently taken offline or converted to another care segment, outweighing added inventory.

E2-CCRC


1Q 2023 Occupancy Distribution by Care Segment – Entrance Fee CCRCs vs. Rental CCRCs

Moving beyond the analysis of average occupancy rates, the exhibit below explores the distribution of occupancy rates across entrance fee and rental CCRC care segments and provides deeper insight into the occupancy patterns.

Interestingly, there is a greater prevalence of entrance fee and rental CCRC care segments within the higher occupancy rate ranges. As the exhibit below shows, the most notable share is observed in the >90% occupancy range, ranging from 36% in rental CCRC nursing care segments to 61% in entrance fee CCRC independent living segments. The 80-90% occupancy range follows, with shares ranging from 17% in rental CCRC memory care segments to 27% in entrance fee CCRC nursing care segments.

Entrance Fee CCRCs. The combination of the 80-90% occupancy range and >90% occupancy range shows that 86% of entrance fee independent living segments reported an occupancy rate above 80% in the first quarter of 2023. This represents the largest share across all care segments and payment types. Assisted living follows closely at 79%, while memory care stands at 74%, and nursing care stands at 68%.

For rental CCRCs, 68% of independent living segments reported an occupancy rate above 80%, followed by assisted living segments at 66%, and memory care and nursing care segments both at 60%.

While these positive figures are encouraging, there are still segments within both entrance fee and rental CCRCs that report relatively low occupancy rates. The largest shares of low occupancy were noted in rental CCRC memory care segments (15% below 50% occupancy, 4% within the 50-60% occupancy range, and 6% within the 60-70% occupancy range) and rental CCRC nursing care segments (12% below 50% occupancy, 4% within the 50-60% occupancy range, and 8% within the 60-70% occupancy range). It is worth mentioning that there are fewer entrance fee care segments within these relatively low occupancy cohorts.

In conclusion, the unprecedented challenges posed by the pandemic have had a profound impact on the senior housing and care industry. To ensure financial stability and sustainability as the sector navigates through recovery, it may be strategic to aim for a higher occupancy rate, even above pre-pandemic levels (this analysis showcased the higher occupancy ranges’ dominance across all care segments). This takes into account the need to mitigate the lingering effects of the pandemic, adapt to changing market dynamics, and address the rising costs of operations. Properties with an occupancy rate above 80%, which are depicted as the majority in this analysis, are likely better positioned to maintain a healthy bottom line and navigate the evolving market conditions.

E3-CCRC

Look for future blog posts from NIC to delve deep into the performance of CCRCs.  
Are you interested in learning more?  To learn more about NIC MAP Vision data, and about accessing the data featured in this article, schedule a meeting with a product expert today.


This article originally appeared in Ziegler’s Senior Living Finance Z-News

“Cycle-Tested” Researchers Weigh in on Market Opportunities

Despite constrained capital markets and a challenging operating environment, senior housing could have a window of opportunity more attractive than it has been for some time. 

Despite constrained capital markets and a challenging operating environment, the senior housing sector could be looking at a window of opportunity far more attractive than it has been for some time. 

Occupancy is recovering. The supply of new properties has slowed in part because of a pullback by lenders. And the long-awaited big demographic wave of baby boomers is finally beginning to break. They’re reaching the age where some type of senior housing makes sense.  

“The stars are starting to align for opportunities looking forward,” said Rick Brace, director at AEW Capital Management. Rick Brace

Brace made the observation during a recent NIC Leadership Huddle, the third in a series of webinars led by NIC Chief Economist Beth Mace. They were joined by Mary Ludgin, senior managing director and head of global research at Heitman.  

“We are pleased to be able to talk with two highly regarded research directors,” said Mace, noting that they’ve experienced the ups and downs of the commercial real estate market. “They’re cycle-tested.”  

Before tackling the specifics of the senior housing segment, the researchers provided context on the macroeconomic climate, the broader commercial real estate sector, capital markets, and valuation trends.  

Expect the Economy to Slow 

An economic downturn seems likely, though when and how deep is hard to predict, the researchers said. 

The most recent consumer price index decelerated to 4%, the smallest 12-month increase since March 2021. Though the pace of inflation is headed in the right direction, Brace expects an economic downturn in part because of volatility in the capital markets.  

Mary LudginAfter 15 months of consecutive interest rate hikes, the Federal Reserve skipped in June on raising rates. But Ludgin thinks the Federal Reserve may have raised interest rates too fast. “The risk is a recession,” she said. 

If the economy is headed toward a recession, Ludgin noted that the commercial property markets are broadly in good shape. The big exception is the office market, beset with vacancy problems as many employees continue to work from home and companies shrink their office space footprints.  

Meanwhile, industrial markets are holding up fairly well and retail properties are beginning to stabilize. Apartments could be somewhat overbuilt, however.  

In 2022, valuations among the public REITs fell about 25%. Private market valuations have not declined that far but could be down 15% over the course of this correction period, according to the researchers.  

Context Counts 

How does this cycle compare to the 2007-2008 Global Financial Crisis (GFC), asked Mace. 

“There’s not a lot to compare,” said Ludgin. The GFC started as a housing downturn with wide geographic scope, followed by a banking meltdown. “We are not seeing something like that,” she said. 

Unlike the zero-interest rate policy (ZIRP) in the wake of the GFC, however, Brace pointed out that this time the cost of capital has been rising quickly. That gives borrowers less wiggle room with lenders. “It’s something to keep an eye on,” he said. 

Putting the latest economic chapter in perspective, Mace compared the pandemic to an earthquake, resulting in secondary aftershocks such as supply chain disruptions and demand spikes. That led to inflation, which the Federal Reserve stepped in to slow with a rapid series of rate hikes. “Now we’re living through the impact,” she said. 

Expectations for investment returns are lower in the near term. But looking ahead there will likely be opportunities for higher returns with potentially lower risks. 

 AEW is rolling out its fifth senior housing investment fund. The fund will initially be less focused on new development. “It’s a little too early,” said Brace. For now, opportunities will be explored in debt platforms, preferred equity, and rescue capital.   

Because of spikes in new construction during the last decade, Heitman had stepped away from equity investments in U.S. senior housing, preferring debt positions instead. But the firm recently made an equity investment in a portfolio that includes existing senior housing and some new development.  

Explaining the shift in strategy, Ludgin noted that a large portion of the existing stock of senior housing is 30-40 years old and becoming obsolete. “That creates an opportunity,” she said. 

Operators are Key 

Underwriting standards haven’t changed much, according to the researchers. Few deals are getting done, so guidelines are a little more conservative.  

“We’re looking for growth in net operating income,” said Brace. Also, concerns are mounting about the huge amount of debt coming due in the next few years. Mace estimated the total at $10-$12 billion. “Refinancing is a challenge,” she said.   

Turning to new investments, both researchers emphasized the importance of the operator in any decision.  

Heitman won’t enter deals with a questionable operator even if the deal looks good on paper. The operator needs a good track record and a clear idea of how to best manage the needs of seniors.  

AEW has had success working with smaller, mid-size operators, though the firm is open to talking to operators of all sizes.  

The webinar ended on an optimistic note. Despite some pricing resets and other challenges, the researchers expect the senior housing market to perform well in the coming years. “We’re well along in this recovery,” said Brace.  

To view the recording of this and other past NIC Leadership Huddle webinars, visit our website 

###

Registration is now open for the 2023 NIC Data & Analytics Conference, the first-of-its-kind forum to discuss best practices in property analysis, learn about key input metrics and collaborate with like-minded peers. The Conference will be held in Minneapolis, September 27-28. Register now!