Introduction
This blog presents an abbreviated portion of the recently released white paper by NIC Analytics. Understanding the population demographics and prevalence of chronic kidney disease (CKD) by market can provide insights about potentially targeting select metropolitan areas in which to develop communities with specialized offerings for senior housing residents with CKD. Due to the differing levels of Medicare beneficiaries (MB) with CKD by metropolitan area, operators may be able target specific markets where they can gain increased resident interest as well as potential additional income by offering services tailored to residents with CKD such as in-home dialysis and specialized dietary support.
Serving the kidney health needs of residents is an opportunity for senior housing operators. About 37 million Americans are estimated to have chronic kidney disease, but many people do not know they have it and are undiagnosed. The CDC estimates that as many as 90% of people who have CKD do not know, and as many as 40% of people with severe CKD do not know. Chronic kidney disease is more common among seniors, with an estimated 38% of people aged 65 and older having CKD.
Most people who have CKD do not reach the point of needing dialysis, but nearly 800,000 Americans do have End Stage Renal Disease (ESRD) with 71% of them requiring dialysis and the remaining 29% receiving a transplant. Older Americans with ESRD comprise ~1% of Medicare patients, but account for ~7% of Medicare spending. In-home dialysis improves patient comfort and flexibility in care plan scheduling, as they have greater ability to adjust the hours and frequency of their treatment.
Dialysis within senior housing properties. Could dialyzing at home in senior housing present a “win-win” for all parties involved? Residents may be more satisfied with their dialysis care and operators can capture Medicare reimbursement. In addition to offering in-home dialysis, operators could distinguish a focus on treatment for CKD by offering additional features like specialized dining, as high protein diets are often recommended. Operators with their own Medicare Advantage or I-SNP plan may be able to capture increased Medicare reimbursement for in-home dialysis done at their properties. Additionally, considering the high rates of underdiagnosis of CKD, operators choosing to specialize care in this area could test residents for CKD to determine unmet needs for kidney health.
The recently released white paper and this blog illustrate how NIC MAP Vision data can help operators understand the local dynamics of a market. In addition to industry-leading senior housing supply and occupancy data, NIC MAP Vision offers subscribers different counts of Medicare beneficiaries (MB) with different types of diagnoses that can be drilled down to local geographies.
For this analysis, we use Medicare beneficiaries (MB) with chronic kidney disease to demonstrate how NIC MAP Vision can support an evaluation of potential demand for this niche specialization. We investigate trends in chronic kidney disease in potential senior housing residents, existing supply of senior housing (inventory), and usage of senior housing (occupancy). A full description of the methodology and limitations and caveats to the analysis can be found here. A similar analysis of the incidence in dementia was recently published by NIC Analytics.
The Medicare beneficiary data do not specify the level of severity of CKD and ESRD is not broken out (that level of detail is not available to NIC MAP Vision from Medicare). As a result, the number of Medicare beneficiaries with CKD included in this analysis is not directly equivalent to the number of people who will need dialysis and at the same time these data also understate the incidence of CKD due to underdiagnosis. These data are still useful in understanding incidence of CKD and market evaluation for operators who may be considering a focused offering for residents with CKD.
Key Findings
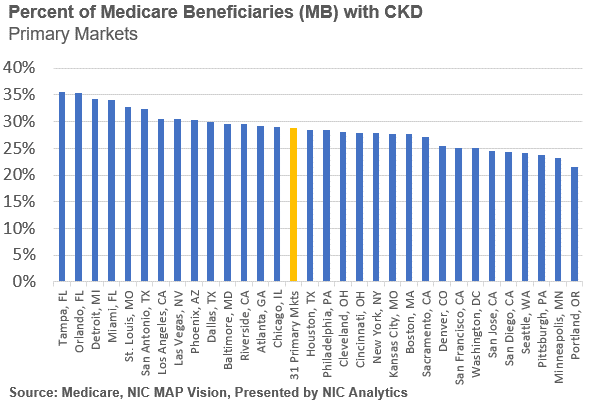
Certain metropolitan markets have higher shares of Medicare beneficiaries with chronic kidney disease, but even markets with lower shares may still hold opportunity. As the chart below demonstrates, the markets with the highest shares of Medicare beneficiaries with chronic kidney disease include:
-
- Tampa (35.5%, 200,351 total MB with CKD)
- Orlando (35.3%, 118,241 total MB with CKD)
- Detroit (34.2%, 223,545 total MB with CKD)
- Miami (34.0%, 352,802 total MB with CKD)
- St. Louis (32.7%, 139,738 total MB with CKD)
- San Antonio (32.4%, 94,801 total MB with CKD)
Markets with the lowest shares of Medicare beneficiaries with chronic kidney disease in the Primary Markets include:
-
- Portland (21.6%, 69,870 total MB with CKD)
- Minneapolis (23.1%, 103,658 total MB with CKD)
- Pittsburgh (23.7%, 104,159 total MB with CKD)
- Seattle (24.1%, 112,675 total MB with CKD)
- San Diego (24.4%, 103,680 total MB with CKD)
Interestingly, Portland, Minneapolis, and Seattle are metros with higher penetration rates of senior housing more generally. Penetration rates are a way to measure use or availability of senior housing and can be calculated in several different ways. NIC has traditionally defined penetration as the sum of senior housing inventory divided by the number of households aged 75+. Some people also think of penetration rates as a proxy for consumer familiarity (higher penetration rates meaning higher levels of familiarity with senior housing as a product). It is interesting that three metros where senior housing is a well-known and established concept are areas where there are lower amounts of Medicare beneficiaries with CKD.
It’s also valuable to note the total numbers of seniors on Medicare with CKD per metro area. Although San Diego has a smaller share of Medicare beneficiaries with CKD than San Antonio, San Diego has a larger total number of Medicare beneficiaries with CKD by nearly 9,000 people.
As previously mentioned, Minneapolis (32.7%), Portland (30.5%), and Seattle (22.4%) are all markets with higher rates of senior housing penetration and have higher levels of senior housing as a share of MB with CKD. Senior housing is a well-established concept in these three metro markets. Interestingly, Kansas City (20.4%) and Denver (20.0%) are also markets with higher levels of senior housing as a share of MB with CKD. Las Vegas (4.9%), New York (5.5%), Los Angeles (7.1%), Riverside (7.3%), and Miami (7.3%) are the five metro markets in the Primary Markets with the lowest shares of senior housing over MB with CKD. The three Florida metros (Tampa, Orlando, and Miami) that are in the top 5 metros of the 31 Primary Markets that have high shares of total MBs with CKD are all under 12% for senior housing as a share of MB with CKD. New York (824,213) and Los Angeles (515,152) are unsurprisingly the two metro markets with the highest total number of MB with CKD.
This demonstrates that in addition to differing incidence of chronic kidney disease among the Medicare beneficiaries, there are also varying levels of senior housing inventory, with some markets like Miami having a high share of MB with CKD, high total numbers, and lower levels of senior housing inventory. However, Miami is a market that was still facing notable occupancy challenges in the fourth quarter of 2021.
The white paper presents additional data findings. Selected metrics provide a baseline for evaluating potential demand, current supply, and current utilization rates of available supply when considering a senior housing product offering tailored to serving the population of seniors with CKD or ESRD. NIC MAP Vision offers these data at more localized levels along with additional data that would be useful to planning a product offering including data on income levels and locations and drive times for hospitals.
Discussion
This analysis demonstrates differing levels in incidence of diagnosed chronic kidney disease among potential residents of senior housing in the Primary Markets and differing levels of senior housing supply and utilization. Improving diagnosis of CKD would also enhance the health of residents and provide additional opportunities for income for operators. The number of people who have CKD is projected to grow in the coming years, meaning that product offerings focused on serving the needs of seniors with chronic kidney disease may have added future demand as well.
With the trends toward increasing dialysis at home, senior housing operators could consider adding opportunities for residents to receive dialysis at home in senior housing to offer additional convenience and potentially create an additional revenue stream. The Medicare beneficiary data as well as the supply and occupancy data sourced from NIC MAP Vision can help support analyses evaluating potential local demand for at home dialysis or other product offerings focused on serving seniors with CKD or ESRD.
For further information on CKD, a case study of an operator serving this market, additional findings from our analysis, well as the full caveats and limitations, please download our white paper.
Sources
i CDC – Chronic Kidney Disease in the US 2021 – https://www.cdc.gov/kidneydisease/publications-resources/CKD-national-facts.html
ii United States Renal Data System, 2020 Annual Report; Transplantation (https://adr.usrds.org/2020/end-stage-renal-disease/6-transplantation)
iii Medicare, VisionLTC data, powered by NIC MAP Vision – https://visionltc.nicmapvision.com/