2Q22 NIC Lending Trends: Senior Housing Mini-Perm/Bridge Lending Rises

The quarterly report, available for free to NIC constituents, currently tracks $86.8 billion in senior housing and nursing care loans.

NIC Analytics released the 2Q 2022 NIC Lending Trends Report today. The quarterly report, available for free to NIC’s constituents, currently tracks $86.8 billion in senior housing and nursing care loans. The report includes data over five years for construction loans, mini-perm/bridge loans, and permanent loans from 3Q 2016 through 2Q 2022.

Takeaways from the 2Q22 NIC Lending Trends Report

The number of delinquent loans continued to edge lower in second quarter 2022 but remains elevated from pre-Covid levels for senior housing. Senior housing delinquencies fell back to third quarter 2021 levels. The delinquency rate (delinquencies as a share of total loans) for both senior housing and nursing care declined and stood at 1.0% for senior housing and 0.9% for nursing care. Despite this overall improvement in delinquency rates, some foreclosures were reported for the sample in second quarter 2022 for both senior housing and nursing care.

E1-2

New mini-perm/bridge loans closed for senior housing were up in second quarter 2022 following a sharp decline in first quarter 2022. On a same-store basis, the quarter-over-quarter increase was 27.0% for senior housing. Nursing care mini-perm/bridge loan closings had a second quarter of negative growth with 7.2% decline in first quarter 2022 and 29.7% in second quarter 2022. However, the new mini-perm/bridge loan closing volume for nursing care remained elevated compared with pre-pandemic levels. The heightened mini-perm/bridge loans in combination with the lowered permanent loans suggests: (1) some lenders may currently be more comfortable issuing a mini-perm over permanent loan for some deals, and (2) the need for financing solutions like mini-per/bridge loans to support business operations, in the midst of relatively low occupancy levels in general and high inflation.

E2-1

For the sample of lenders in the Lending Trends Report, nursing care new construction loan closings hit a new peak in second quarter 2022, the highest level since at least 2016 but still relatively low in comparison to senior housing. The quarter-over-quarter same-store growth for nursing care new construction loan closings was 15.1% in second quarter 2022. Senior housing new construction loan closings continued to increase through the second quarter of 2022 at a growth of 47.1% on a same-store quarter-over-quarter basis. However, the senior housing new construction loan volume closed remained below its recent peak in third quarter 2021.

Looking ahead. These trends may differ later in the 2022 data set as higher interest rates and inflation start to impact loan volumes and construction activities. Notably, in third quarter 2022, construction starts for senior housing and nursing care weakened and showed signs of a looming slowdown, according to NIC MAP Vision data. Additionally, construction spending in the U.S. fell into negative territory with negative 0.6% in July 2022 and negative 0.7% in August 2022, and pending home sales in the U.S. had the largest contraction in September 2022 year-over-year since the start of the pandemic in April of 2020, according to the U.S. Census Bureau. Further, debt market yield spreads continue to remain elevated as investors require additional yield to take more perceived risk due to rising interest rates and inflation.

Note: These data are not to be interpreted as a census of all senior housing and skilled nursing lending activity in the U.S., but rather reflect lending activity from participants included in the survey sample only.

The 3Q2022 NIC Lending Trends Report is scheduled be released in mid-February 2023.

Interested in participating? The NIC Lending Trends Report helps NIC Analytics to deliver on NIC’s mission to enable access and choice by further enhancing transparency of capital market trends in the senior housing and care sectors. We very much appreciate our data contributors. This report would not be possible without them.

If you would like to participate and contribute your data, please contact us at analytics@nic.org. As a courtesy for providing data, data contributors receive this report early before publication on the website. The information provided as part of the survey will be kept strictly confidential. Individual answers will be combined with the answers of all other respondents. Data acquired from this survey will only be reported in the aggregate, and therefore, the resulting aggregated data will not be attributed to you or your company upon distribution.

261k New Jobs Created in October: Jobless Rate Inched Higher to 3.7%

The U.S. Bureau of Labor Statistics reported nonfarm payrolls rose by 261k in October 2022 and the unemployment rate rose 0.2 percentage point to 3.7%.

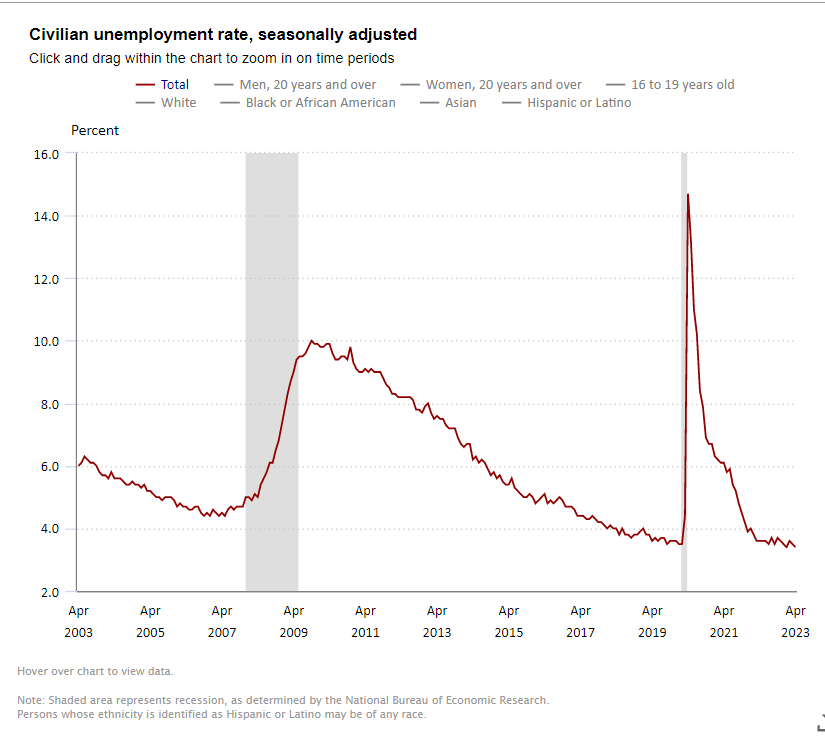
The U.S. Bureau of Labor Statistics reported that nonfarm payrolls rose by 261,000 in October 2022 and the unemployment rate rose 0.2 percentage point to 3.7%. The October increase was well below the year-to-date average of 407,000 and below the monthly average of 562,000 seen in 2021. The monthly gain paints an image of a still growing, but slowing, labor market. For perspective, in 2019, job gains averaged 164,000 per month. Revisions added 29,000 positions to total payrolls in the previous two months.

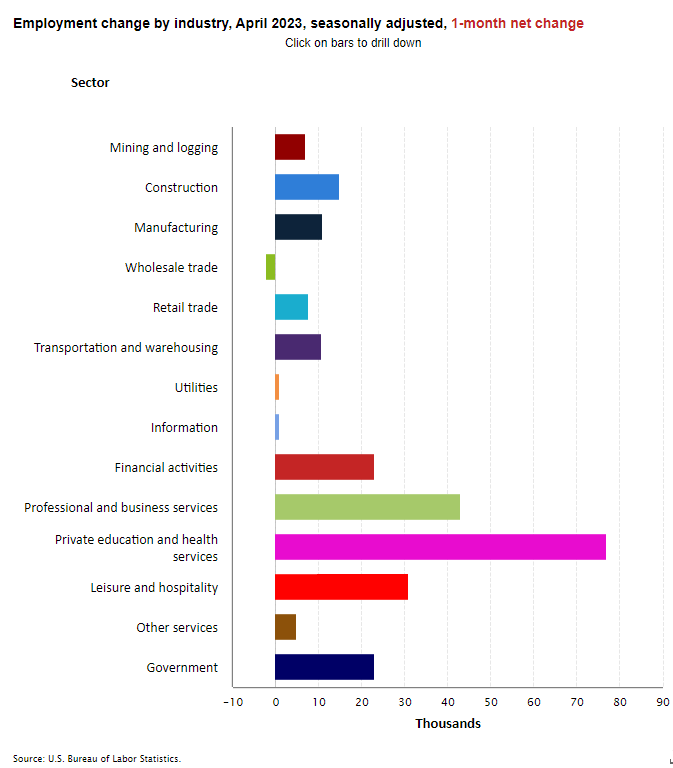
Employment in health care rose by 53,000 in October and has increased by an average of 47,000 per month in 2022 compared with 9,000 in 2021. Employment in nursing care facilities was up by 4,100 jobs from last month and 17,800 jobs from year-earlier levels and stood at 1,367,000 positions.

2022 NIC Notes Blog Employment October Civilian Unemployment Rate Graph

Today’s labor report is not likely to affect the Fed’s view on the economy. It is looking for the job market to slow further and the inflation rate to be tempered before it will adjust its aggressive stance on monetary policy. In his statement on Wednesday, Federal Reserve Chair Jay Powell said “The broader picture is of an overheated labor market where demand substantially exceeds supply …. I don’t see the case for real softening just yet.”

The Federal Reserve raised short-term interest rates for the sixth time this year on Wednesday, November 2nd. This marked the fourth consecutive 0.75 percentage point increase and followed earlier increases in 2022 of lesser amounts. The latest increase pushed the Fed Funds rate to a range of 3.75% to 4.00%, up from 0% at the beginning of the year. The rapid rise in interest rates is the most aggressive pace of monetary policy tightening since the early 1980s and is in response to inflation which remains near a 40-year high by most measures. In its announcement of higher interest rates, Powell said that when the Fed considers future interest rate increases, it “will take into account the cumulative tightening of monetary policy, the lags with which monetary policy affects economic activity and inflation, and economic and financial developments.” This may suggest smaller increases in rates at its final 2022 meeting in December and going into January. But Powell also said that “The (FOMC) Committee anticipates that ongoing increases in the target range will be appropriate in order to attain a stance of monetary policy that is sufficiently restrictive to return inflation to 2 percent over time …. We still have some ways to go and incoming data since our last meeting suggests that the ultimate level of interest rates will be higher than previously expected,” he said.

In a separate survey conducted by the BLS, the jobless rate rose 0.2 percentage point to 3.7% in October. In September, the jobless rate had once again fallen to its pre-pandemic level of 3.5% seen in February 2020. Both months’ unemployment rates are well below the 14.7% peak seen in April 2020.

2022 NIC Notes Blog Employment October Employment by Industry Graph

Among the major worker groups, the October unemployment rates were 3.4% for adult women, adult men (3.3%), teenagers (11.0%), Whites (3.2%), Hispanics (4.2%), Blacks (5.9%), and Asians (2.9%).

Average hourly earnings for all employees on private nonfarm payrolls rose by $0.12 in October to $32.58. This was a gain of 4.7% from year-earlier levels, still high, but lower than the gain in September (5.0%) and August (5.2%).

The labor force participation rate slipped back to 62.2% in October from 62.3% in September and 62.4% in August and was below the February 2020 level of 63.4%.

Earlier this week, the BLS released its JOLTS report that showed the number of job openings rose to a seasonally adjusted 10.7 million in September from 10.3 million in August. That was below the peak of 11.9 million in March, but still well above their pre-pandemic level in early 2020 when it averaged 7.0 million. This means that there are roughly 1.9 open positions for every person looking for work in September, up from 1.7 in August. The hirings rate did fall according to the JOLTS survey as did the quits rate, indications that the labor market is slowing a bit.

Skilled Nursing Occupancy Continued Increase in August 2022

NIC MAP Vision released its Skilled Nursing Monthly Report on November 3, 2022, including key monthly data points from January 2012 to August 2022.

“Occupancy has increased throughout 2022, which suggests demand for skilled nursing is growing. However, retaining adequate staff is still challenging and limits the ability to increase patient admissions.”

-Bill Kauffman

NIC MAP Vision released its latest Skilled Nursing Monthly Report on November 3, 2022. The report includes key monthly data points from January 2012 through August 2022.

Here are some key takeaways from the report:

Skilled nursing occupancy continued to increase in August, rising 48 basis points from July to end the month at 78.8%. This is the highest occupancy rate since April 2020. There has been positive occupancy momentum throughout 2022 and it is up 580 basis points since the low point reached in January 2021 (73.0%). However, COVID-19 cases created additional challenges last year (2021), which slowed some of the initial momentum and the staffing crisis in the sector is still a significant burden on skilled nursing operators. Occupancy remains 8.4 percentage points below the pre-pandemic February 2020 level of 87.2%. As staffing, wage growth, and general inflation pressures persist, operations for many operators will be under pressure but the long-term demand for skilled nursing services is expected to grow over time.

SNF Blog Slides Aug 2022_Final_Page_15While Medicare revenue mix and the revenue per patient day both increased in August, they are down from earlier in the year. In January and February of 2022, increased cases of COVID-19 resulted in additional need for utilizing the 3-Day rule waiver and per day reimbursement for COVD-19 positive patients. Indeed, Medicare revenue mix ended August at 22.0% but is down from its pandemic high of 24.9% set in February 2022. Medicare RPPD is down 2.9% from its pandemic peak of $590 in June 2020. Meanwhile, Managed Medicare revenue mix was down 15 basis points to 10.4% in August. However, this is 229 basis points above the pandemic low of 8.1% set in May 2020.
SNF Blog Slides Aug 2022_Final_Page_13

Managed Medicare revenue per patient day (RPPD) decreased in August and is down 1.2%% from year-earlier levels. Depending on an operator’s business model, the continued decline in managed Medicare revenue per patient day can pose a challenge as the reimbursement differential between Medicare fee-for-service and managed Medicare has increased during the past two years. However, some operators see opportunity to capture patient volume with the growth of managed care. Medicare fee-for-service RPPD ended August 2022 at $573 and managed Medicare ended at $453, representing a $120 differential. In August of 2020, the differential was $105.

After decreasing slightly in the month of July, Medicaid patient day mix increased 23 basis points ending August at 64.9%. However, it has increased 252 basis points from the pandemic low of 62.4% set in February 2022. Meanwhile, Medicaid revenue mix declined 25 basis points from the prior month, ending August at 50.8%. One element of the Medicaid revenue share of a property’s revenue is RPPD and that declined 0.33% from July. However, it up 0.8% since last year in August 2021.

Get more trends from the latest data by downloading the Skilled Nursing Monthly Report. There is no charge for this report.

The report provides aggregate data at the national level from a sampling of skilled nursing operators with multiple properties in the United States. NIC continues to grow its database of participating operators to provide data at localized levels in the future. Operators who are interested in participating can complete a participation form on our website . NIC maintains strict confidentiality of all data it receives.

Economic Uncertainty Clouds Outlook

The U.S. economy holds both upside and downside risks that will impact the senior housing and care industry in the near term.

Better Times Expected as Baby Boomers Start to Arrive

The U.S. economy holds both upside and downside risks that will impact the senior housing and care industry in the near term. Inflation is high, labor costs are up, and the price of capital is rising. But low unemployment, moderate growth in consumer spending, and a recent uptick in GDP are relative bright spots.

Higher interest rates should help prevent overbuilding. Looking beyond the next 24-36 months, owners and operators should benefit as demand increases with the arrival in 2026 of the first baby boomers to turn 80.

Economic forecaster Jason Schenker mapped out the state of the economy and what’s ahead during the keynote address at the 2022 NIC Fall Conference. Attendees packed the ballroom to hear his remarks at the Marriott Marquis, Washington D.C. The Conference was held September 14-16, drawing more than 2,800 attendees.

2022 NIC Fall Conference Schenker 1 600x300

In a “noisy” economy where predictions fluctuate daily, Schenker gave his remarks in mid-September. He noted at the time that the economy faced more downside than upside risks.

Inflation continues to be a big risk. The annual inflation rate was 8.2% at the end of September, compared to 8.3% the previous month, according to the U.S Labor Department. “The inflation rate is (closest to) the highest it’s been since 1981,” said Schenker, founder of Prestige Economics and chairman of The Futurist Institute.

Employment costs were up 5.7% year-over-year in the second quarter of 2022. Added to that, workers are switching jobs. A report by the Pew Research Center shows that from April 2021 to March 2022, 60% of those who left their jobs for a new company saw real wage gains. Only 47% of those who took a new job at their present company saw real wage gains. “You have to work elsewhere to beat inflation,” said Schenker. “That’s scary when you’re thinking about your staffing needs.”

Wages are not going to retreat. The labor market is a seller’s market, a situation Schenker expects to continue for a while.

The Impact of Inflation

In an effort to curb inflation, the U.S. Federal Reserve has raised interest rates by 3 percentage points since last March, when the rate was near zero. Schenker anticipates more hikes before the end of the year. The Federal Reserve is expected to raise rates again on November 2.

“Will the Fed’s policy work?” asked Schenker. Inflation will remain “sticky” for a while despite the Federal Reserve’s aggressive policies, he said. Geopolitical risks such as the war in Europe and a worldwide rise in energy prices are out of the control of the U.S. central bank.

Rising interest rates are slowing the housing market, a big concern for senior housing owners and operators whose residents often sell a house to move into a retirement community.

Mortgage rates topped 7% at the end of October. Demand for mortgages and home prices are falling. On the plus side, mortgage delinquency rates remain relatively low.

Lending for commercial real estate is also feeling the pinch of higher interest rates and greater caution on the part of lenders. This is translating into slower transaction volumes and was apparent in third quarter data from NIC MAP Vision. Transaction volumes totaled $1.1 billion on a preliminary basis for senior housing and care in the third quarter, the weakest quarterly volume since early 2010.

2022 NIC Fall Conference Schenker 2 600x300

Winning Strategies

Looking ahead, Schenker emphasized the positive impact of demographics as aging baby boomers require senior housing and care services. “You will have a never-ending stream of potential residents,” said Schenker. He added that high interest rates are likely to constrain new construction which means there will be more demand for senior housing than the available supply can accommodate.

Several challenges also lie ahead. Medicare faces insolvency in 2026 and Social Security in 2034. Healthcare costs continue to outstrip inflation. The healthcare workforce shortage is not expected to ease. In fact, 5 of the top 10 sectors expected to have the highest job growth are in healthcare, including the personal care aides who work in assisted living. About 1.1 million new workers will be needed in the sector by 2030. “The demand is monstrous,” said Schenker.

Technology will play a role to fill the worker shortage in senior living. Wearable tracking devices can help monitor residents. Automated drug dispensers can improve efficiency and reduce the risk of medication errors. But Schenker doesn’t think robot caregivers in the home will replace the need for assisted living anytime soon. “That will take a long time,” he said.

In conclusion, Schenker asked, “What are the winning strategies for the economic uncertainty we face?” His recommendation: “Focus on ROI,” quickly adding that the only two ways to boost net income are to sell more or spend less.

Schenker also suggested some approaches. Revisit vendor agreements. Raise rents. Be cautious about speculative investments. Focus on operational resilience. “Stick to the fundamentals,” he said.

Schenker warned that the next 2-3 years will be tough as inflation and worker shortages continue to impact the sector. But owners and operators should also plan for the future when there will be a limited number of facilities and more demand for senior living. “Looking beyond the immediate challenging period there is upside opportunity,” he said.

California’s Middle-Income Population Projections

The analysis revealed several key findings about the potential unmet needs of California’s middle-income seniors.

Building upon the groundbreaking “Forgotten Middle” study and its subsequent update, NORC at the University of Chicago recalibrated a nationally representative forecast of the 2033 middle-market population to produce estimates reflective of future California residents. The analysis revealed several key findings about the potential unmet needs of California’s middle-income seniors, including:

  • The middle-income senior population in California will increase to 1.6 million in 2033 (+60%). Notably, the number of middle-income seniors aged 85 and older in the state is expected to double, from 230,000 to 463,000.

NORC Forgotten Middle CA - Findings_Page_16 V2

While the middle-income senior population is expected to grow substantially in the next decade, only a portion will be able afford the projected cost of private-pay assisted living. With the annual out-of-pocket price point of assisted living and medical care in California at $75,000, even with housing equity, more than half (821,000) of middle-income seniors in California will likely not have the financial resources to afford them. Without housing equity, nearly 90% are projected to struggle with covering the cost of private assisted living over the next decade.

By reducing the potential price point of assisted living, the potential market size expands. If operators can reduce the price point of assisted living by $10,000, an additional 209,000 Californians – an increase of over 25% – would then have the resources available to afford that product.

  • By 2033, 58 percent of California’s middle-income seniors will be unmarried, and 43 percent may not have children living within 10 miles.

NORC Forgotten Middle CA - Findings_Page_13

Having spousal support enables many people to stay in their homes longer and means assets and financial resources remain pooled together. Having children nearby means an increased likelihood of being able to utilize family caregivers. But as people have fewer children – and those children are increasingly less likely to live nearby – this solution becomes harder to make a reality.
These demographic shifts result in fewer available caregivers, which we know as a national ratio falls from seven adult children (aged 45 to 64) to care for one parent over 80 years old to four-to-one in 2030 and three-to-one in 2050.

  • One in five middle-income seniors in California will have cognitive impairments or high needs. A majority will have three or more chronic conditions and mobility limitations.

NORC Forgotten Middle CA - Findings_Page_12

The study also found that most of California’s middle-income seniors are likely to develop multiple chronic conditions and mobility limitations in the next decade, making it challenging for them to live independently.

Additionally, researchers with NORC at the University of Chicago have created illustrative case studies that underscore and help provide examples of the impact these findings have for Californians. View the complete slide deck of findings, including methodology, key findings, case studies, and information on the “near dual” seniors cohort who are close to Medicaid eligibility.