Key Takeaways:
Data from the recently released 2Q 2024 NIC MAP Vision Actual Rates Report show that independent living:
- Saw the most notable slowdown in the year-over-year growth for initial rates (move-in rates).
- Reported the highest discounts.
- Showed the greatest improvement in the pace of move-ins.
- Achieved the largest differential between move-ins and move-outs.
These factors help explain the relatively larger occupancy gains reported in the independent living segment compared to assisted living and memory care (31 NIC MAP Primary Markets) in the second quarter of 2024.

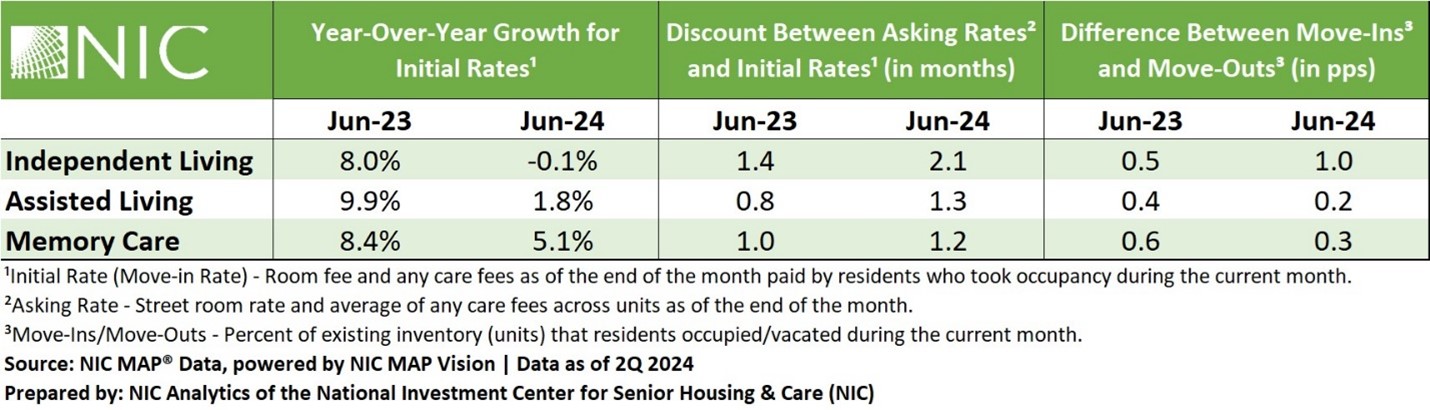
In the second quarter of 2024, the year-over-year growth in initial rates slowed across all senior housing segments, with the independent living segment experiencing the most notable decline.
In June 2024, the year-over-year growth for initial rates (move-in rates) in independent living was negative 0.1%, down from 4.1% in March 2024 and 8% in June 2023. A similar decline was observed with the initial rates for the assisted living segment which grew by 1.8% year-over-year in June 2024, a sharp decline from 9.9% in the previous year.
Meanwhile, the memory care segment recorded the highest year-over-year increase in initial rates among the three care segments, with a 5.1% growth in June 2024. However, this was still lower than the growth rate reported one year ago.
Discounts between asking rates and initial rates for all care segments reached new highs in the second quarter of 2024, with independent living reporting the largest discounts.
- For the independent living segment, discounts between asking rates and initial rates averaged about 16% in the second quarter of 2024. The June 2024 discount was $781, equivalent to 2.1 months of “free rent” on an annualized basis compared to the asking rate, which is up from $463 or 1.4 months in June 2023.
- Discounts between asking rates and initial rates in the assisted living segment averaged 9.4% in the second quarter of 2024. The June 2024 discount reached a new high of $723, equivalent to 1.3 months of “free rent” on an annualized basis compared to the asking rate.
- In the memory care segment, the average discount for asking rates compared with initial rates was 10.3% in the second quarter of 2024. The dollar discount ($884) in June 2024 was equivalent to 1.2 months of “free rent” on an annualized basis compared to the asking rate.
Move-ins exceeded move-outs in the second quarter of 2024 across all care segments, with independent living properties reporting notable improvements.
- In the independent living segment, the pace of move-ins accelerated in the second quarter of 2024. In June 2024, move-ins averaged 2.6% of Inventory, while the pace of move-outs averaged 1.6%. The resulting 1.0 percentage point difference between move-ins and move-outs was the largest since at least 2019.
- For the assisted living segment, move-ins remained unchanged and averaged 3.1% of inventory in the second quarter of 2024 compared to 3.2% in the first quarter of 2024.
- Move-ins for the memory care segment averaged 3.6% of inventory in the second quarter of 2024 compared to 3.7% in the first quarter of 2024.
Additional key takeaways are available to NIC MAP Vision subscribers in the full report.
About the Report
The NIC MAP Vision Seniors Housing Actual Rates Report provides aggregate national data from approximately 300,000 units within more than 2,700 properties across the U.S. operated by 35 to 40 senior housing providers. The operators included in the current sample tend to be larger, professionally managed, and investment-grade operators as a requirement for participation is restricted to operators who manage 5 or more properties. Visit NIC MAP Vision’s website for more information.