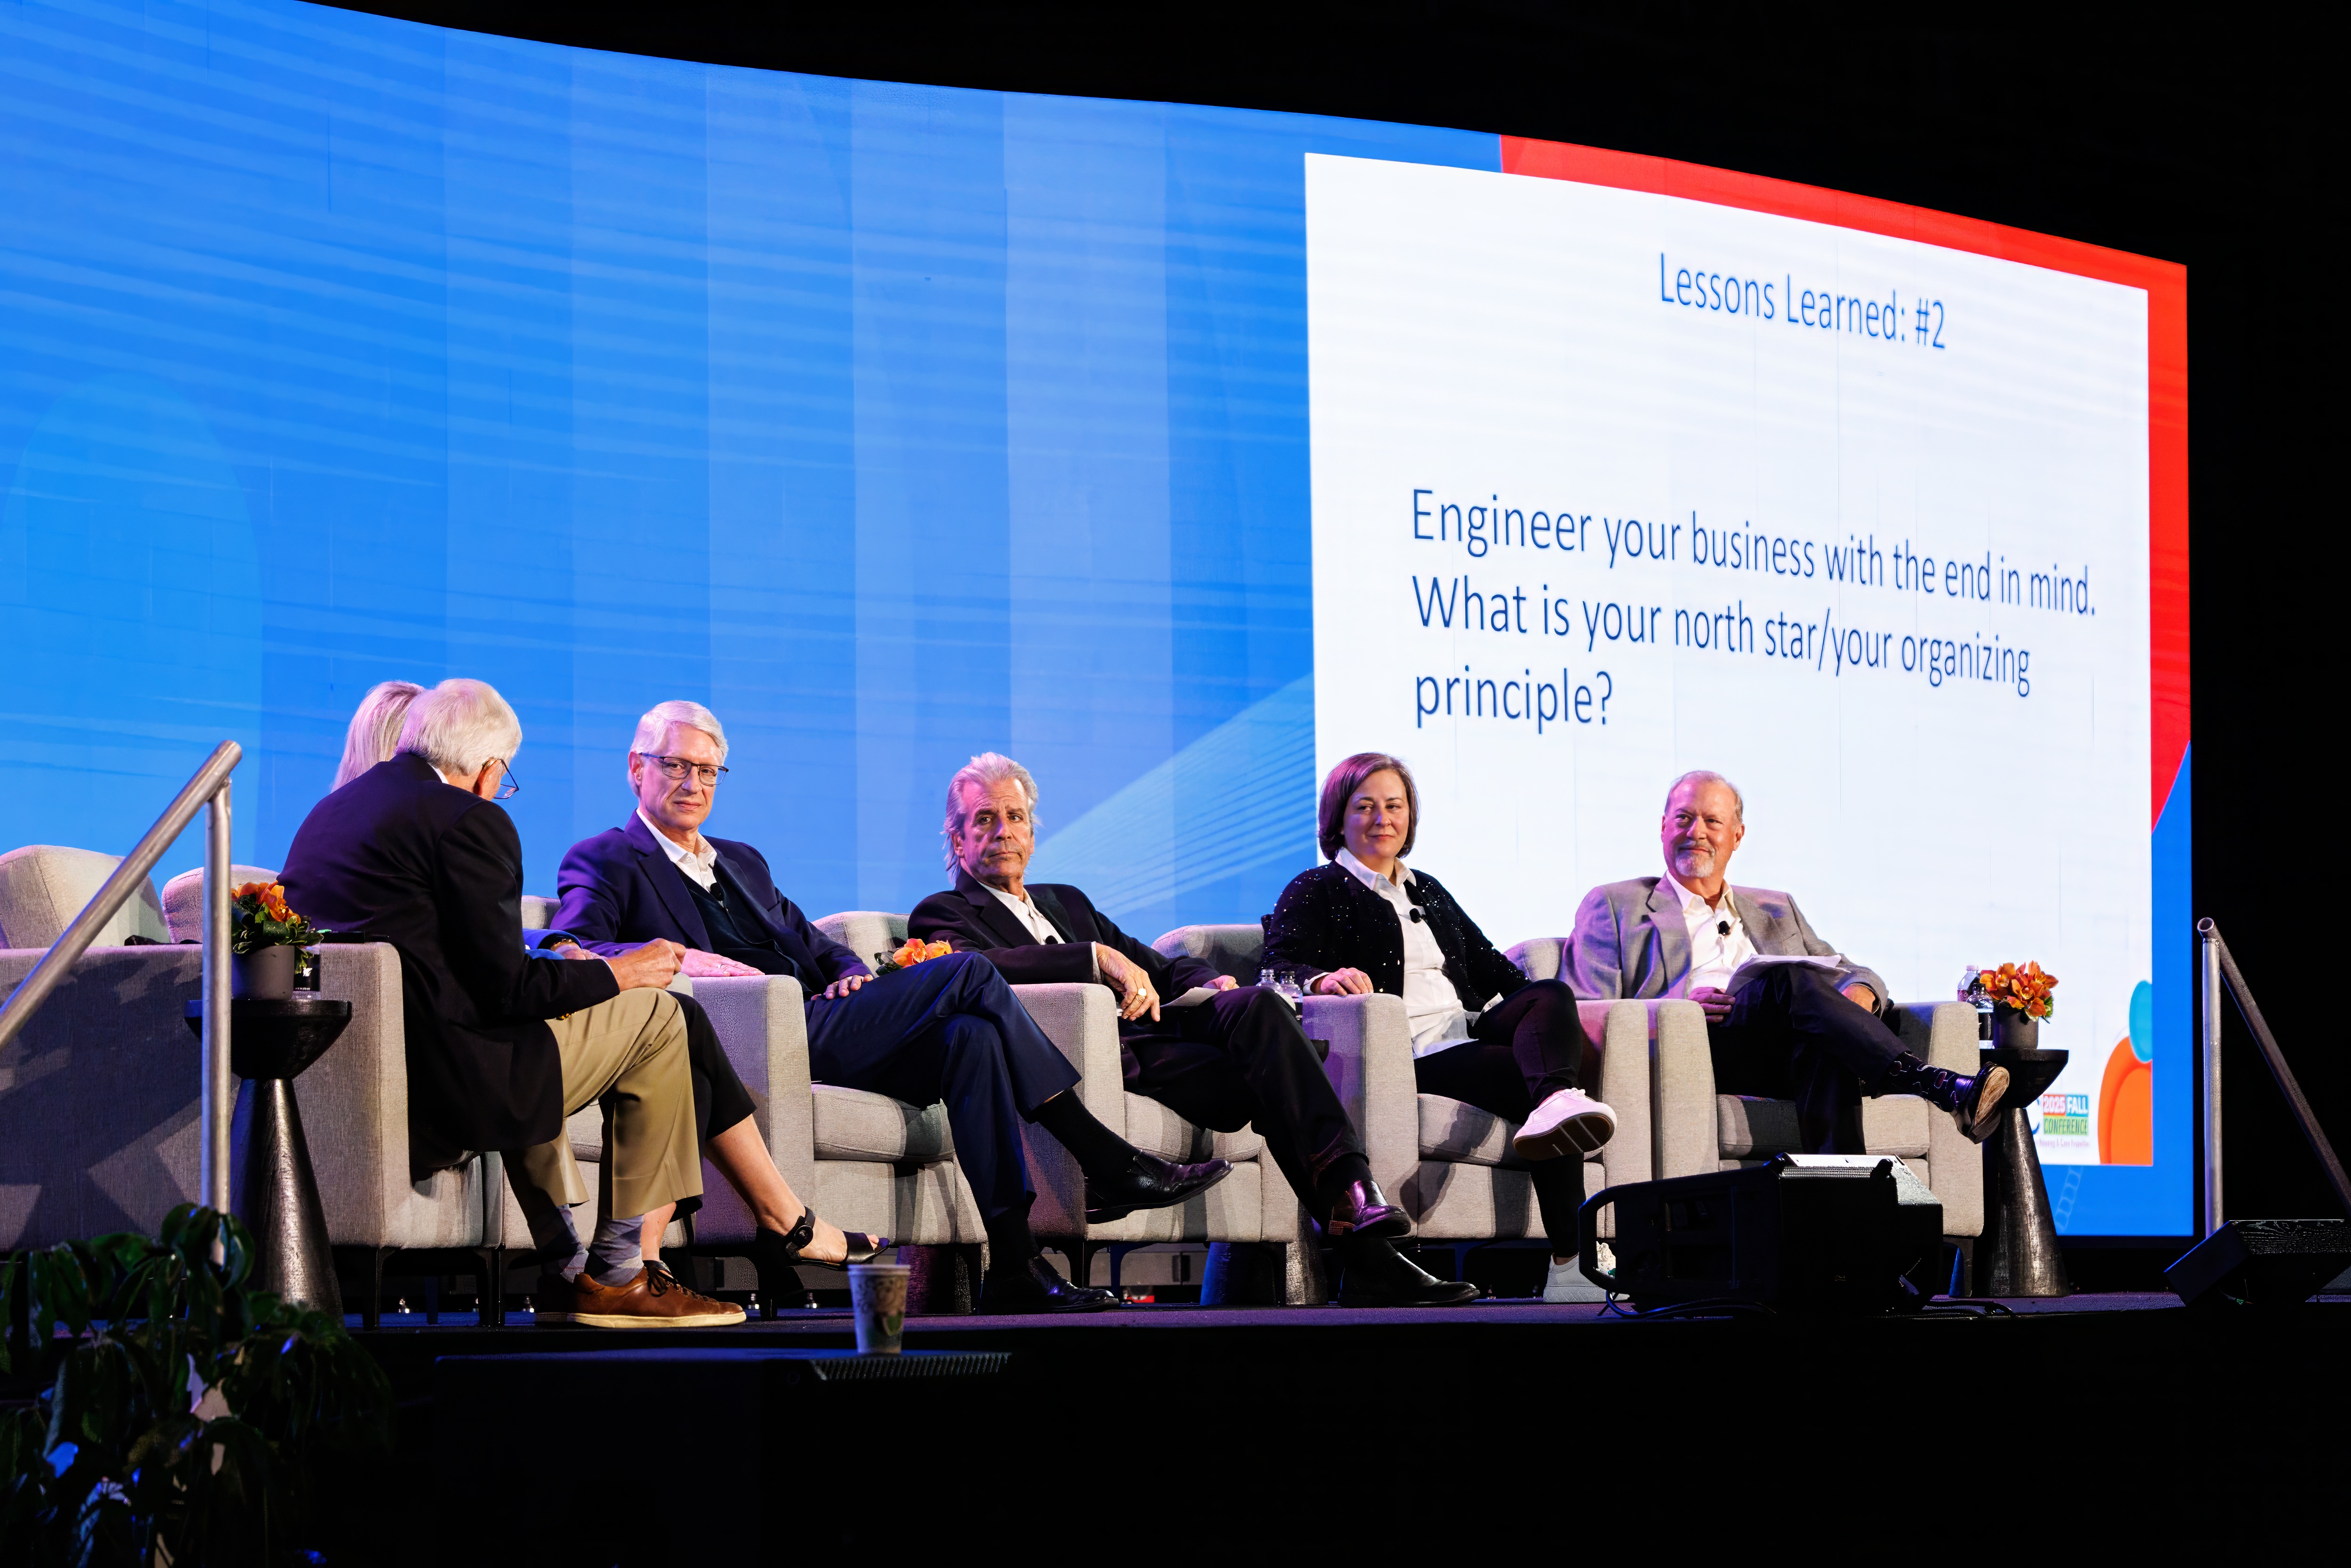
Reflecting on 30 years of senior living evolution, a panel of veteran investors, developers, and operators shared their most valuable lessons learned to guide future decision making as the industry enters what could be a super-cycle of growth. The lively panel discussion took place at the 2025 NIC Fall Conference and drew a packed audience.
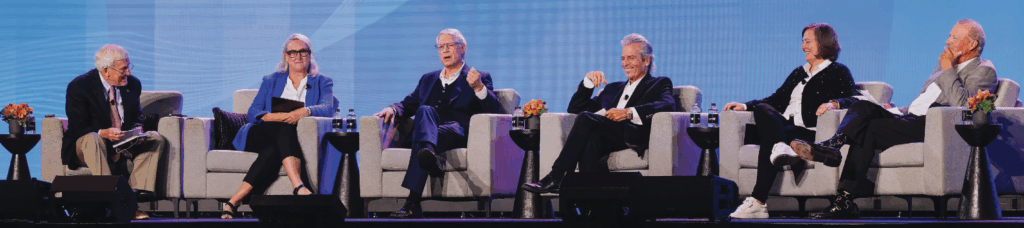
“We’re presenting six lessons learned of both the successes and the failures, so hopefully we can all be wiser in the next growth cycle,” said NIC Co-Founder and Strategic Advisor Bob Kramer, who moderated the session.
Kramer set the discussion in context by noting that today’s market conditions—high consumer demand, compelling demographics and historically low levels of new supply—echo earlier boom times.
Here are the six lessons learned from the leaders who’ve already experienced the industry’s highs and lows.
1- Develop your business model around the customer you plan to serve.

While that sounds simple, it’s more complicated than that, according to panelist Kurt Read of RSF Partners. He identifies three elements necessary to increase the probability of success. First is a laser-like focus on a particular type of customer. Secondly, build a culture and operating model to serve that customer. Lastly, create an environment with a cost structure and margin of safety that supports scalable growth.
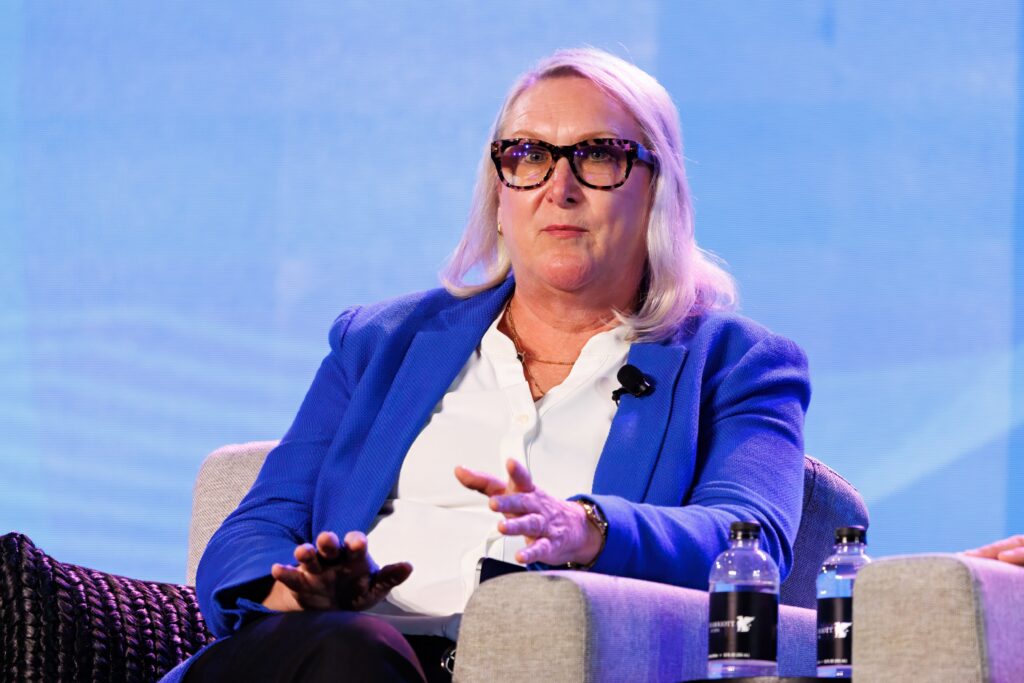
Panelist Leigh Ann Barney of Trilogy Health Services said the company’s core operating principle is to create a hospitality type experience in a healthcare setting. Trilogy also offers a continuum of care and stays focused on properties in the Midwest. Lesson learned: Stick to what you’re good at.
2- Define your North Star.
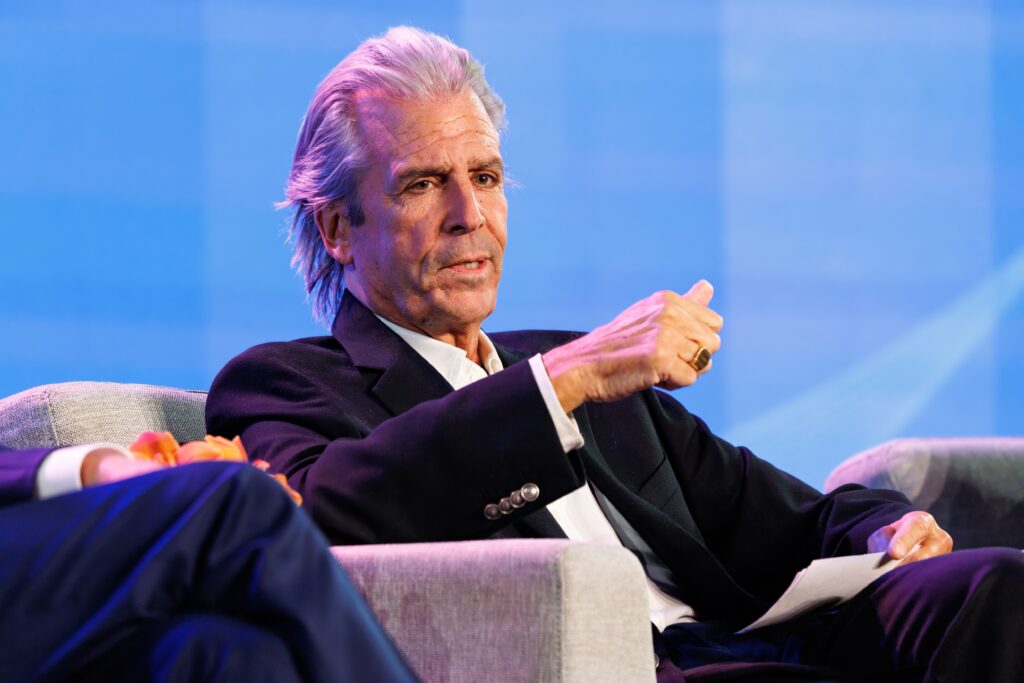
“Engineer your business with the end in mind,” said John Rijos of Chicago Pacific Founders and CPF Living Communities. Too often, companies jump into senior living without a clear plan or vision of what kind of communities they want to own.
For Steven Vick of Signature Senior Living, his North Star is understanding his customer: a frail resident in need of assisted living or skilled care at a price point below that of the cost of a private room in a nursing home. That formula works for Signature which focuses on middle-market communities in Northeast Texas. Vick learned an important lesson when he worked at Alterra Healthcare during its go-go days in the late 1990s, opening a building every 32 hours. “Don’t do that,” he said.
3- Make sure your capital partner understands and supports your business model.
Customer strategy must inform capital, not vice versa. Stephanie Harris of Arrow Senior Living entered the industry as a turnaround consultant in 1999 to help clean up some of the casualties of the overbuilding during that era. “It allowed me to think about what kind of capital partner I would want to work with,” she said. Harris eventually rebranded her business as Arrow Senior Living, managing 39 properties. “We found the right capital partner. We’re very fortunate,” she said. “We worked on getting it right from the very beginning.”
4- Avoid being overleveraged. Prepare for the unexpected.
“Being overleveraged is your Achilles’ heel,” warned Rijos. During the pandemic, he recalled that some developers built communities with only 15% equity and 85% debt. “That’s a disaster,” said Rijos. “Things will go wrong. There will be downturns.” He added that if you can’t put at least 35-40% of equity into the community then you shouldn’t do the deal.
During his time at Alterra, Vick also learned that debt is not your friend. “Be the owner of ‘no,’” he said. Signature has been successful because Vick has been able to say ‘no’ to extras, like swimming pools, that don’t support the frail customer at a middle-market price point.
5- Maintain focus. Understand the relationship between operational complexity and growth.
Trilogy offers a continuum of care. “Our business is very complex because of all the service lines we offer,” said Barney. “That’s why we’ve stayed focused in geographic areas that we know.” This clustering strategy has helped Trilogy grow to 130 campuses in five states.
6- Build an organizational culture and trust in your team.
“Always solve your people-problems first,” said Rijos. “Then a lot of the other problems will take care of themselves.” Build trust in the organization. For example, give the executive director the ability to try a new approach without a penalty if it fails. He prefers flat organizational structures rather than those with multiple management layers.
Trilogy invests in its workforce with a robust apprenticeship program for every hourly position. “It’s not just wages or benefits, but how we invest in their retention,” said Barney. “We’ve chosen to do that through education and growth opportunities. Our employees drive our engine.”
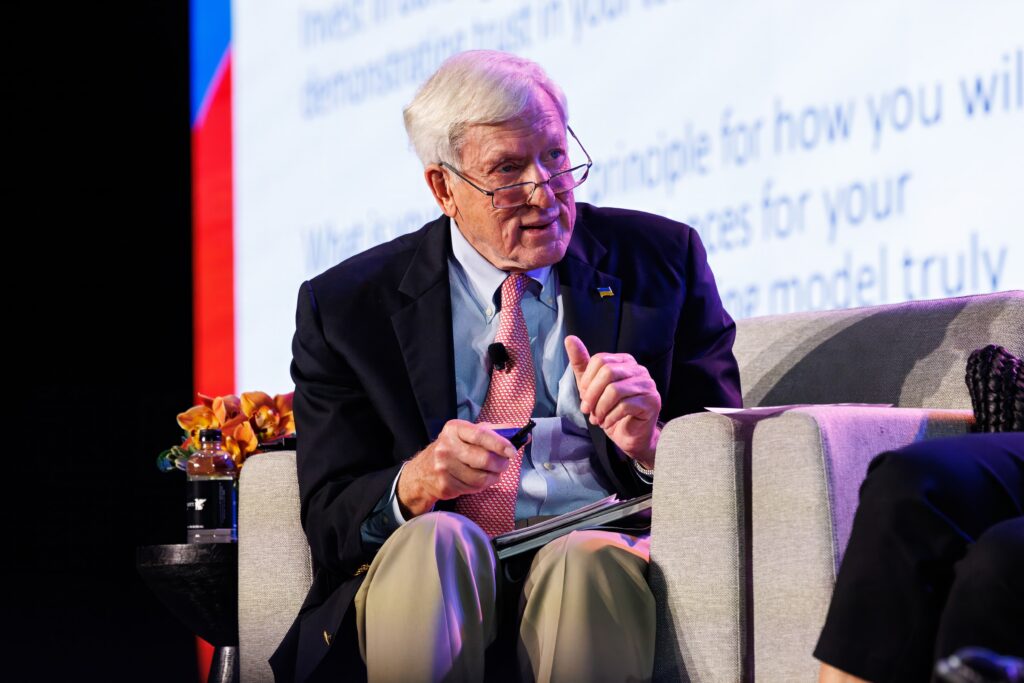
Kramer wrapped up the session by encouraging attendees to create successful operating models and investment structures as the industry evolves over the next 30 years. “Take these six lessons learned back to your team and put them into practice,” he said.
Watch a replay of the full NIC Fall Conference session here: Understanding the Past of Senior Housing and Long-Term Care to Prepare for Our Future.