Senior Living Thought Leader Randy Bufford: “We Need to Invest in People”

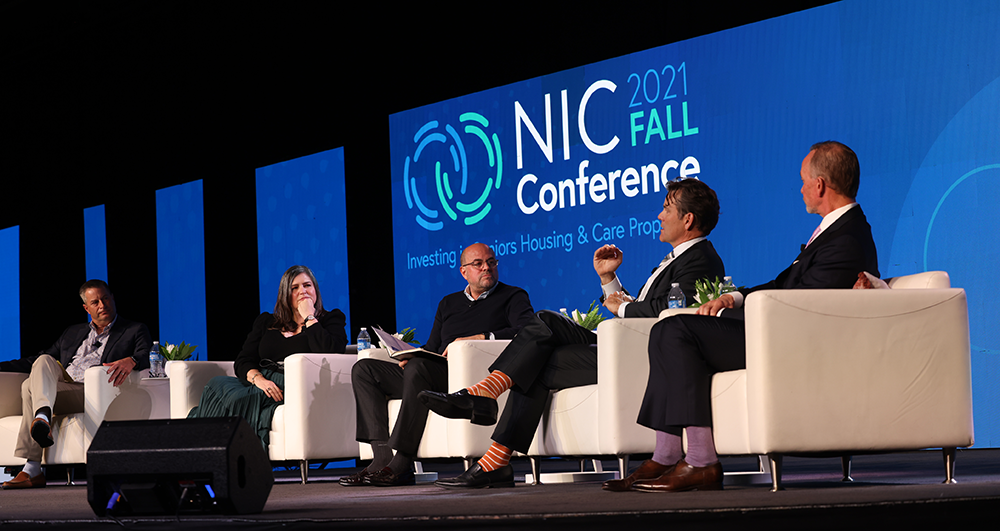
What’s ahead for senior housing and care? Randy Bufford has some thoughts on the topic. As Founder and Chairman of Trilogy Health Services, Bufford is one of the thought leaders attending the 2021 NIC Fall Conference in Houston.

What’s ahead for senior housing and care?

Randy Bufford has some thoughts on the topic. As Founder and Chairman of Trilogy Health Services, Bufford is one of the thought leaders attending the 2021 NIC Fall Conference in Houston. The Conference is NIC’s first in-person convening of leaders in senior housing and care since the pandemic began.

NIC recently talked to Bufford in advance of the event to get his take on the industry’s outlook. Many industry leaders plan to attend the Conference to share ideas with others experiencing the same challenges, while also building the relationships that will help them succeed in the future.

Bufford identified five senior living trends to watch:

  1. Labor shortage. “This is the most difficult labor market I’ve ever seen in my 39 years in the industry,” said Bufford. “We need to invest in people.” Trilogy’s approach is to put employees first. “Great staffing leads to great customer service,” he added. Bufford’s advice: Focus on retention. For Trilogy, that means a holistiRandy Bufford Headshot Prof (1)c approach including training programs and apprenticeships to create a career path, a servant leader culture that demonstrates that the company cares about them, and frequent, strategic wage increases. Trilogy, which has 124 communities, raises employee wages gradually, every quarter. Bufford calls it the company’s quarterly wage investment, a program to boost the pay of the lowest paid workers. Caregiver positions today pay $15 an hour and up. “Make those investments wisely and the industry should be able to solve these staffing challenges,” he said.

                        “We need to invest in people.”

  2. Private units. As one of the largest builders of new skilled nursing facilities in the country, Trilogy has switched its prototype design to all private rooms. The pandemic only highlighted the need for greater infection control which is easier to achieve with private rooms. “Dual occupancy units in skilled nursing should be changed,” he said.
  3. Advances in technology. Telehealth is likely here to stay. Remote visits got a big boost when Medicare expanded coverage of telehealth services during the pandemic. Many expect the coverage to continue when the health emergency ends—a net plus for the industry. Also, monitoring devices will continue to be refined to help improve resident health and reduce labor costs.
  4. Innovative infection controls. The pandemic highlighted the need for new approaches. Trilogy launched The SHIELD program, as a comprehensive view of infection control, applying the latest disinfection and cleaning tools. The communities are also equipped with a UV light system that destroys 99.99% of surface and airborne pathogens. Trilogy continues to experiment with special ventilation and filtration products to determine whether they can help limit the spread of viruses. “We’ve learned a lot of tough lessons during the pandemic, but they’re good lessons,” said Bufford.
  5. The intersection of demography and affordability. Overall, Bufford is bullish on the industry as the number of seniors who need help continues to grow. But the rising older population, especially among those seeking an affordable housing option, is colliding with the labor shortage. Bufford sees a possible solution by engaging families in caregiving since they already provide a lot of care services at home. The idea would be to move those relationships to a senior living community where the family would help provide care in return for a reduced cost of services. “The operators that win will be those that innovate in their approach to find ways to provide better care, more efficiently,” predicted Bufford.

The Pandemic is Not  Over for Skilled Nursing Facilities with Low Vaccination Rates

4.8% of skilled nursing facilities or nursing homes reported newly confirmed cases among residents for the week ending August 1, 2021, according to CMS data compiled by NIC’s Skilled Nursing COVID-19 Tracker.

According to the most recent CMS data compiled by NIC’s Skilled Nursing COVID-19 Tracker, 4.8% of skilled nursing facilities (SNFs) reported newly confirmed cases among residents for the week ending August 1, 2021. Half of these facilities had a vaccination rate among staff below 49%, which is 12 percentage points below the national average rate of staff fully vaccinated (60.7%) according to NIC’s Skilled Nursing Covid-19 Tracker. As has been reported elsewhere, the pandemic is likely not over for the unvaccinated. Unfortunately, this includes skilled nursing facilities with low vaccination rates among staff and residents according to analysis by NIC.

With the Delta variant changing the narrative once again by fueling the resurgence in COVID-19 cases in the U.S. and pushing parts of the country with low vaccination coverage into a new wave of the COVID-19 pandemic, the per-resident rate of new COVID-19 infections within SNFs rose to 0.18%, meaning that 18 in 10,000 residents tested positive on August 1. This is equivalent to six times the rate reported on June 20 (0.03% – 3 in 10,000 residents tested positive) but is also well below the peak of 3.06% (306 in 10,000 residents tested positive) reached in December of 2020. Moreover and notably, overall case counts within SNFs relative to cases among the general population remained low compared with the high share of cases seen in SNFS in the fall of 2020 wave prior to the vaccine rollout.

Regionally, the highest per-resident rate of new COVID-19 infections was seen in the South at 0.34% (the highest rate in six months), followed by the Midwest (0.11% – doubled in the last three weeks), the West (0.10% – relatively flat), and the Northeast (0.06% – doubled from the prior week ending July 25).

For the week ending August 1, the South region alone accounted for about 68% of newly confirmed cases within all U.S. skilled nursing facilities. In the span of six weeks, virus cases among SNFs residents in the South region went from 97 cases on June 20 to 1,340 cases on August 1, up 1,281%. This is partly due to increasing Delta variant cases among the general population in the South (up 888% between the weeks ending June 20th and August 1st), specifically in Texas and Florida.

Low vaccination rates among SNFs staff in some parts of the country are also contributing to recent increases. Overall, 82.5% of SNFs residents are fully vaccinated vs. 60.7% of staff. While these rates have been gradually ticking up week-over-week, there are still many skilled nursing facilities with low vaccination rates among both residents and staff.

Exhibit 1 below depicts vaccination stats and infection rates by region. Notably, the South region had the lowest rate of residents and staff fully vaccinated against COVID-19 at 79.2% and 54.4%, respectively. At 54.4%, the South region vaccination rates among staff remained far below the national average (60.7%). On the other hand, SNFs in the West and Northeast regions had above national average rates of staff fully vaccinated at 72.0% and 67.8%, respectively.

Exhibit 1: Skilled Nursing Facilities – Per-Resident Rate of New COVID-19 InfectionsSNF Tracker Blog 081921

Looking closely at states in the South region with low vaccination rates and increasing virus cases, Florida newly reported cases among the general population reached record highs on August 1. In six weeks, weekly cases in Florida jumped over 1000%, from nearly 11,000 on June 20 to over 120,000 cases on August 1 and continued to climb through the week ending August 8, according to CDC data compiled by NIC’s Skilled Nursing COVID-19 Tracker. Prior to the outbreak of the Delta variant, the high point for Florida was about 110,000 cases for the week ending January 10, 2021.

The worrisome spike in virus cases among the general population in Florida and the low vaccination rates within skilled nursing facilities there (72.9% of residents fully vaccinated vs. 47.1% of staff) pushed weekly cases among SNFs residents back up from 39 on June 20 to 556 on August 1, up 1326%.

Similarly, weekly cases among the general population in Texas increased by about 640%, from over 8,300 on June 20 to nearly 62,000 new cases on August 1, and weekly confirmed cases among SNFs residents increased at a faster pace over the same period, from 15 cases on June 20 to 235 cases on August 1 (a very large percentage increase of 1467% due to the low starting point). Again, skilled nursing facilities in Texas have one of the lowest rates of their residents and staff fully vaccinated against COVID-19 at 78.6% and 56.8%, respectively.

Vaccination rates among SNFs staff in Florida and Texas remained below national average rate of staff fully vaccinated (60.7%). These two states accounted for 40% of overall weekly cases within U.S. SNFs on August 1st.

Conversely, California continued to report a relatively low number of cases among residents weekly (59 cases on August 1). In fact, California is one of the very few states with a vaccination rate among staff and residents above 80%. (Hawaii and Puerto Rico are the other parts of the country with 80%+ vaccination rate among staff and residents). Visit nic.org/snf-covid-tracker for SNFs vaccination rates by state.


1900x400_SN_landingGraphic_V5

October 11-20, 2021

{{cta(‘cded5c49-0152-4bb8-af91-66b8635614d2’)}}


Weekly COVID-19 cases among the U.S. general population vs. skilled nursing residents

Overall case counts within SNFs relative to cases among the general population remained low and are nowhere near levels seen in the fall of 2020 wave prior to the vaccine rollout. The notable difference in virus cases among the general population and SNFs residents between the fall 2020 variant wave and the ongoing surge of the Delta variant suggests that facilities with low vaccination rates are likely driving SNFs COVID case rise.

Exhibit 2 below shows normalized trends of weekly COVID-19 cases among the general population and SNFs residents reaching a six-month high with over 600,000 cases and nearly 2,000 cases reported for the week ending August 1, respectively. Newly confirmed cases among residents on August 1 accounted for one-third of 1% of overall weekly cases in the U.S., and the share of SNFs reporting newly confirmed cases among residents stood at 4.7%.

 In early November 2020, when weekly COVID-19 case counts among the general population were about the same level as August 1, 2021 (about 600,000 cases), weekly cases among SNFs residents were about seven times cases reported on August 1, equivalent to 14,216 cases and accounting for 2.4% of overall weekly cases in the U.S. Additionally, the share of SNFs reporting newly confirmed cases among residents was about 17% on November 1, 2020.

On August 1, the normalized trend of the weekly COVID-19 cases among the general population broke through the weekly average line of 550,000 cases (average computed over the period from June 6, 2020, to August 1, 2021), while the normalized count of virus cases within skilled nursing facilities remained far below the weekly average of 9,000 cases.

Exhibit 2: Weekly COVID-19 Cases – Normalized Count | U.S. vs. SNFsTest 2


Although there have been reports of COVID-19 breakthrough cases across the U.S. and skilled nursing facilities, data corroborates vaccine effectiveness against the Delta variant. Recent studies have shown that overall effectiveness may be declining against infections but remains very strong against hospitalization and fatalities from the Delta variant. To say the least, vaccines are helping to avoid another “deadly” wave of the COVID-19 pandemic.

This upward trend in Delta variant infections is concerning and will likely persist in the coming weeks until an extremely high vaccination rate is reached. That said, U.S. vaccination rates have recently accelerated, and the U.S. will begin to offer coronavirus booster shots to raise antibody levels among at-risk adults on September 20, including residents of skilled nursing facilities and seniors housing properties.

Separately, vaccine effectiveness is also reflected in the wide dispersion in occupancy between facilities, which is somewhat tied to virus spread among residents and staff. Additionally, NIC’s Executive Survey Insights (Wave 31: July 12 to August 8, 2021) shows occupancy improvements and acceleration in the pace of move-ins. “Despite the rise in circulation of the Delta variant of the COVID-19 virus, resident demand remains the driving force behind acceleration in the pace of move-ins. Between roughly 55% and 60% of organizations report that the pace of move-ins accelerated in the past 30-days, and similar proportions report a corresponding increase in occupancy” wrote Lana Peck, Senior Principal at NIC.


Executive Survey Insights | Wave 31: July 12 to August 8, 2021

NIC’s Executive Survey of operators in seniors housing and skilled nursing is designed to deliver transparency into market fundamentals in the seniors housing and care space as market conditions continue to change.

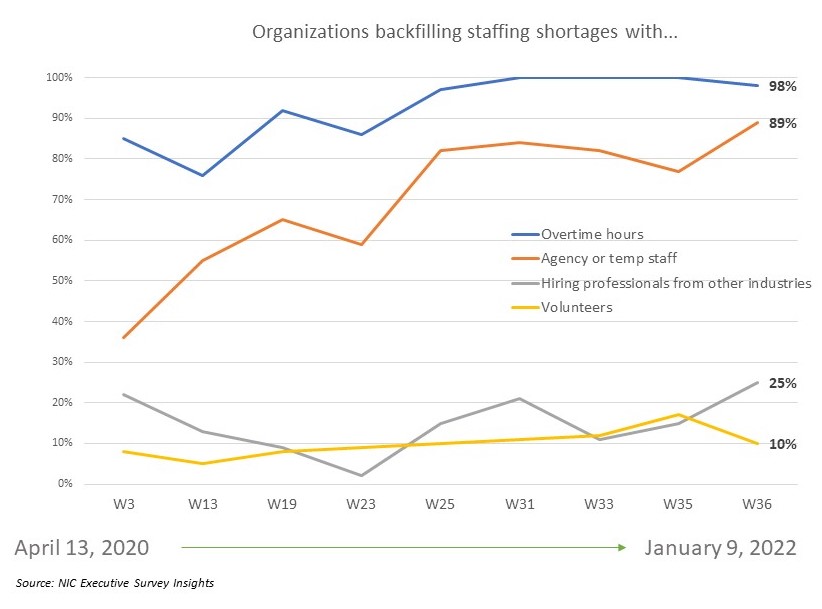
“Despite the rise in circulation of the Delta variant of the COVID-19 virus, resident demand remains the driving force behind acceleration in the pace of move-ins. Between roughly 55% and 60% of organizations report that the pace of move-ins accelerated in the past 30-days, and similar proportions report a corresponding increase in occupancy. Other reasons for relatively strong pace of move-ins include residents moving through the continuum of care and the success of redoubled marketing efforts. NOI is likely being squeezed as all respondents in the Wave 31 survey indicated their organizations were experiencing staffing shortages, and all are currently paying staff overtime hours (100%), up from a low of 76% in the Wave 13 survey conducted in early-October 2020.

–Lana Peck, Senior Principal, NIC

NIC’s Executive Survey of operators in seniors housing and skilled nursing is designed to deliver transparency into market fundamentals in the seniors housing and care space as market conditions continue to change. This Wave 31 survey includes responses collected July 12 to August 8, 2021, from owners and executives of 70 small, medium, and large seniors housing and skilled nursing operators from across the nation, representing hundreds of buildings and thousands of units across respondents’ portfolios of properties.

Detailed reports for each “wave” of the survey and a PDF of the report charts can be found on the NIC COVID-19 Resource Center webpage under Executive Survey Insights.

Wave 31 Summary of Insights and Findings

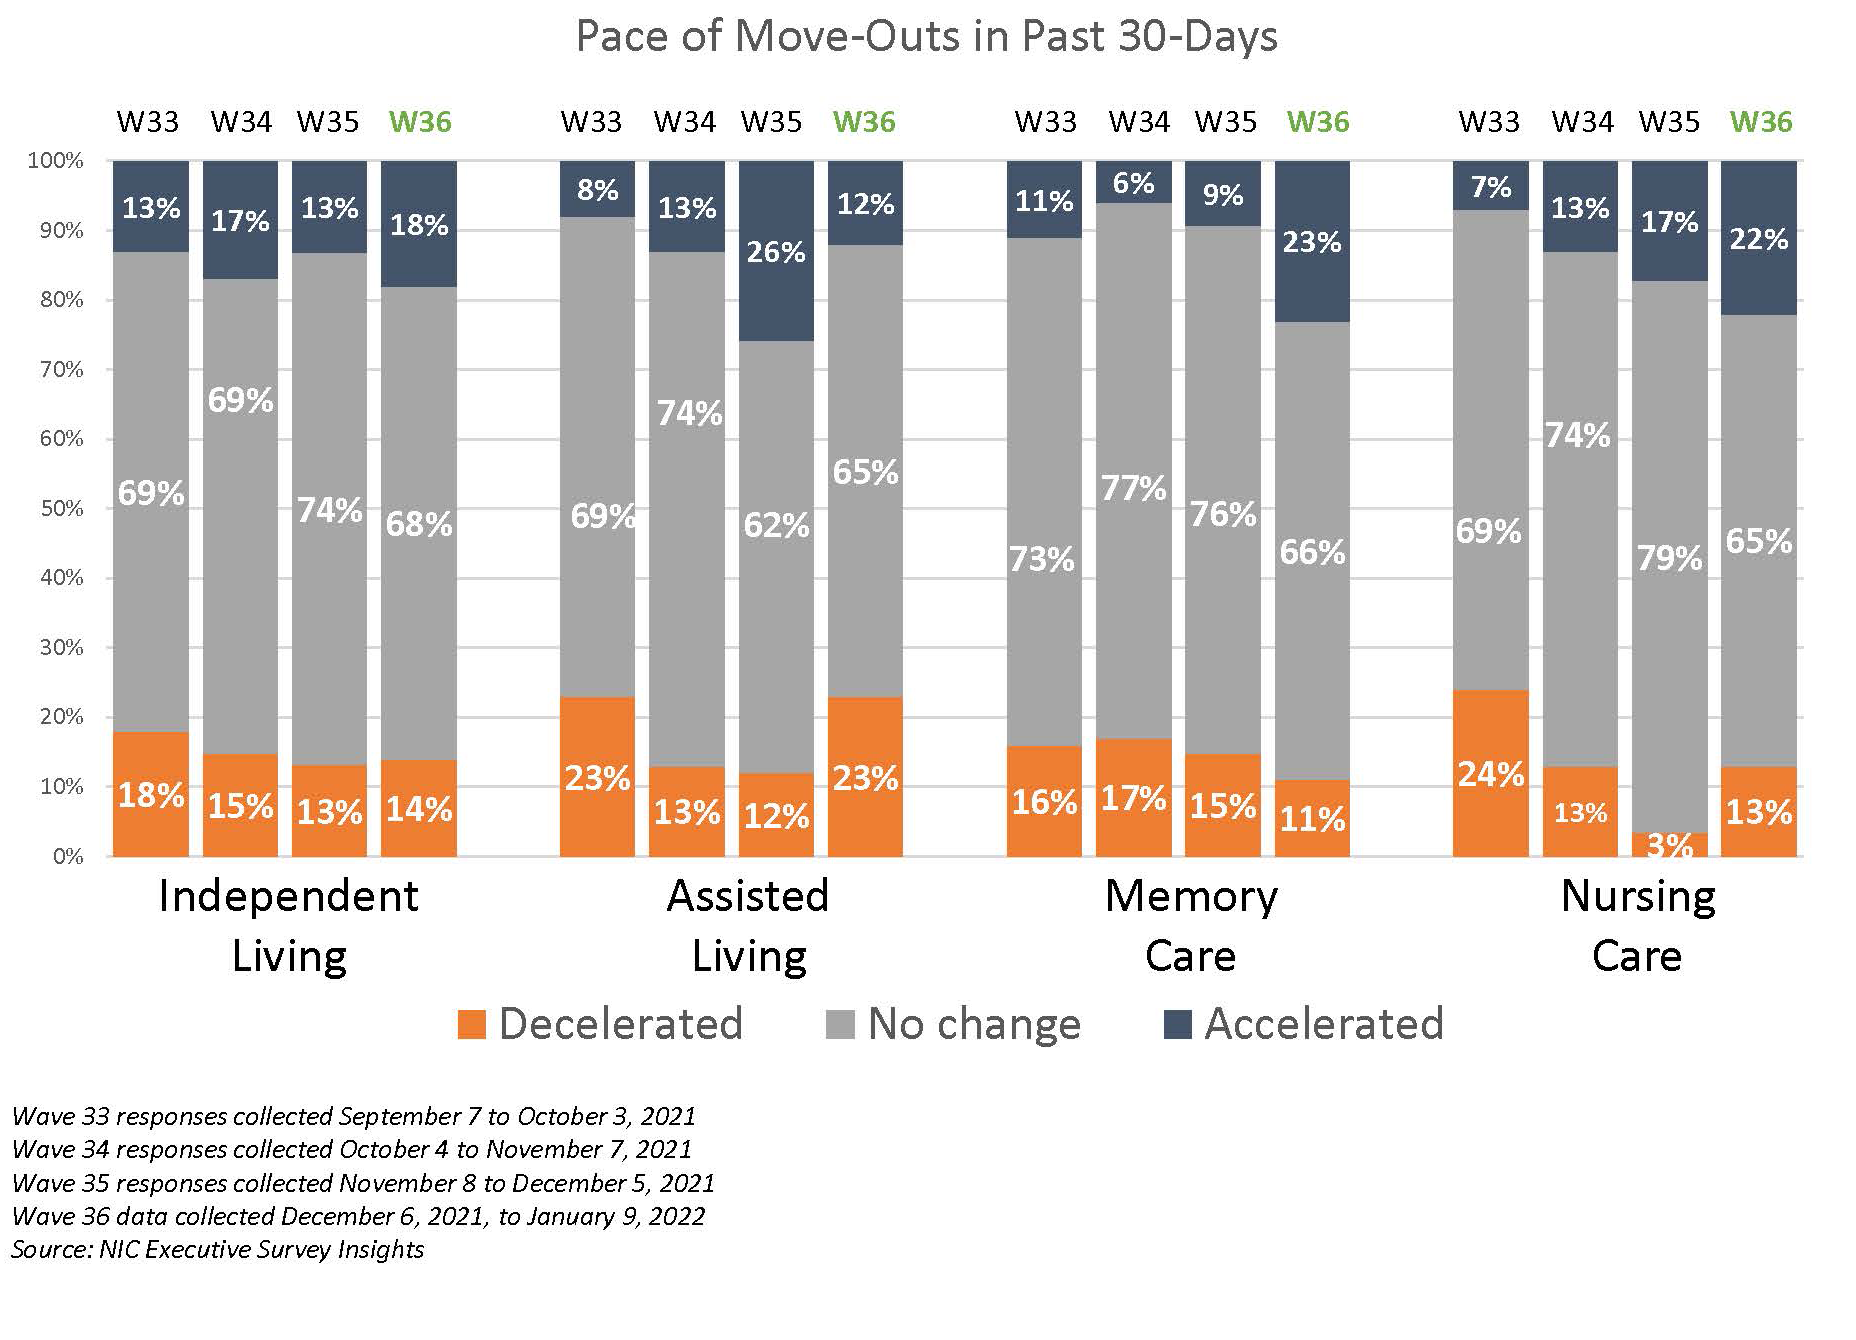
  • Between roughly 55% and 60% of respondents note that the pace of move-ins accelerated in the past 30-days. The shares of organizations reporting acceleration in the pace of move-ins varied slightly from recent surveys for independent living, assisted living and memory care segments. For nursing care, the shift was a bit larger, with fewer organizations reporting acceleration in the pace of move-ins in Wave 31 compared with Waves 29 and 30. For nursing care, around half (54%) saw the pace of move-ins accelerating in the past 30-days, down from 70% in Wave 30 and possibly reflecting the uptick in COVID-19 cases in areas of the country with low vaccination rates.     
  • The chart below illustrates the full time series of Executive Survey Insights data collected since near the beginning of the pandemic in March 2020 to August 8, 2021, regarding the pace of move ins for the nursing care segment. Looking across 31 waves of survey responses one can see the improvement in the pace of move-ins (blue segments) after the vaccine was distributed in Wave 18 (late December) in sharp contrast to the significant deceleration in the pace of move-ins witnessed earlier in the pandemic (orange segments).

  • Increased resident demand has been cited by nine out of ten respondents as a reason for acceleration in move-ins since the Wave 25 survey conducted in the latter half of March. In the Wave 31 survey, the percent of respondents citing hospital placement declined from 42% in Wave 30 to 21%. This decrease may reflect concerns about the rise in circulation of the Delta variant of the COVID-19 virus in many areas of the country. Other reasons for a shift in move-in patterns include residents moving through the continuum of care and the success of redoubled marketing efforts.

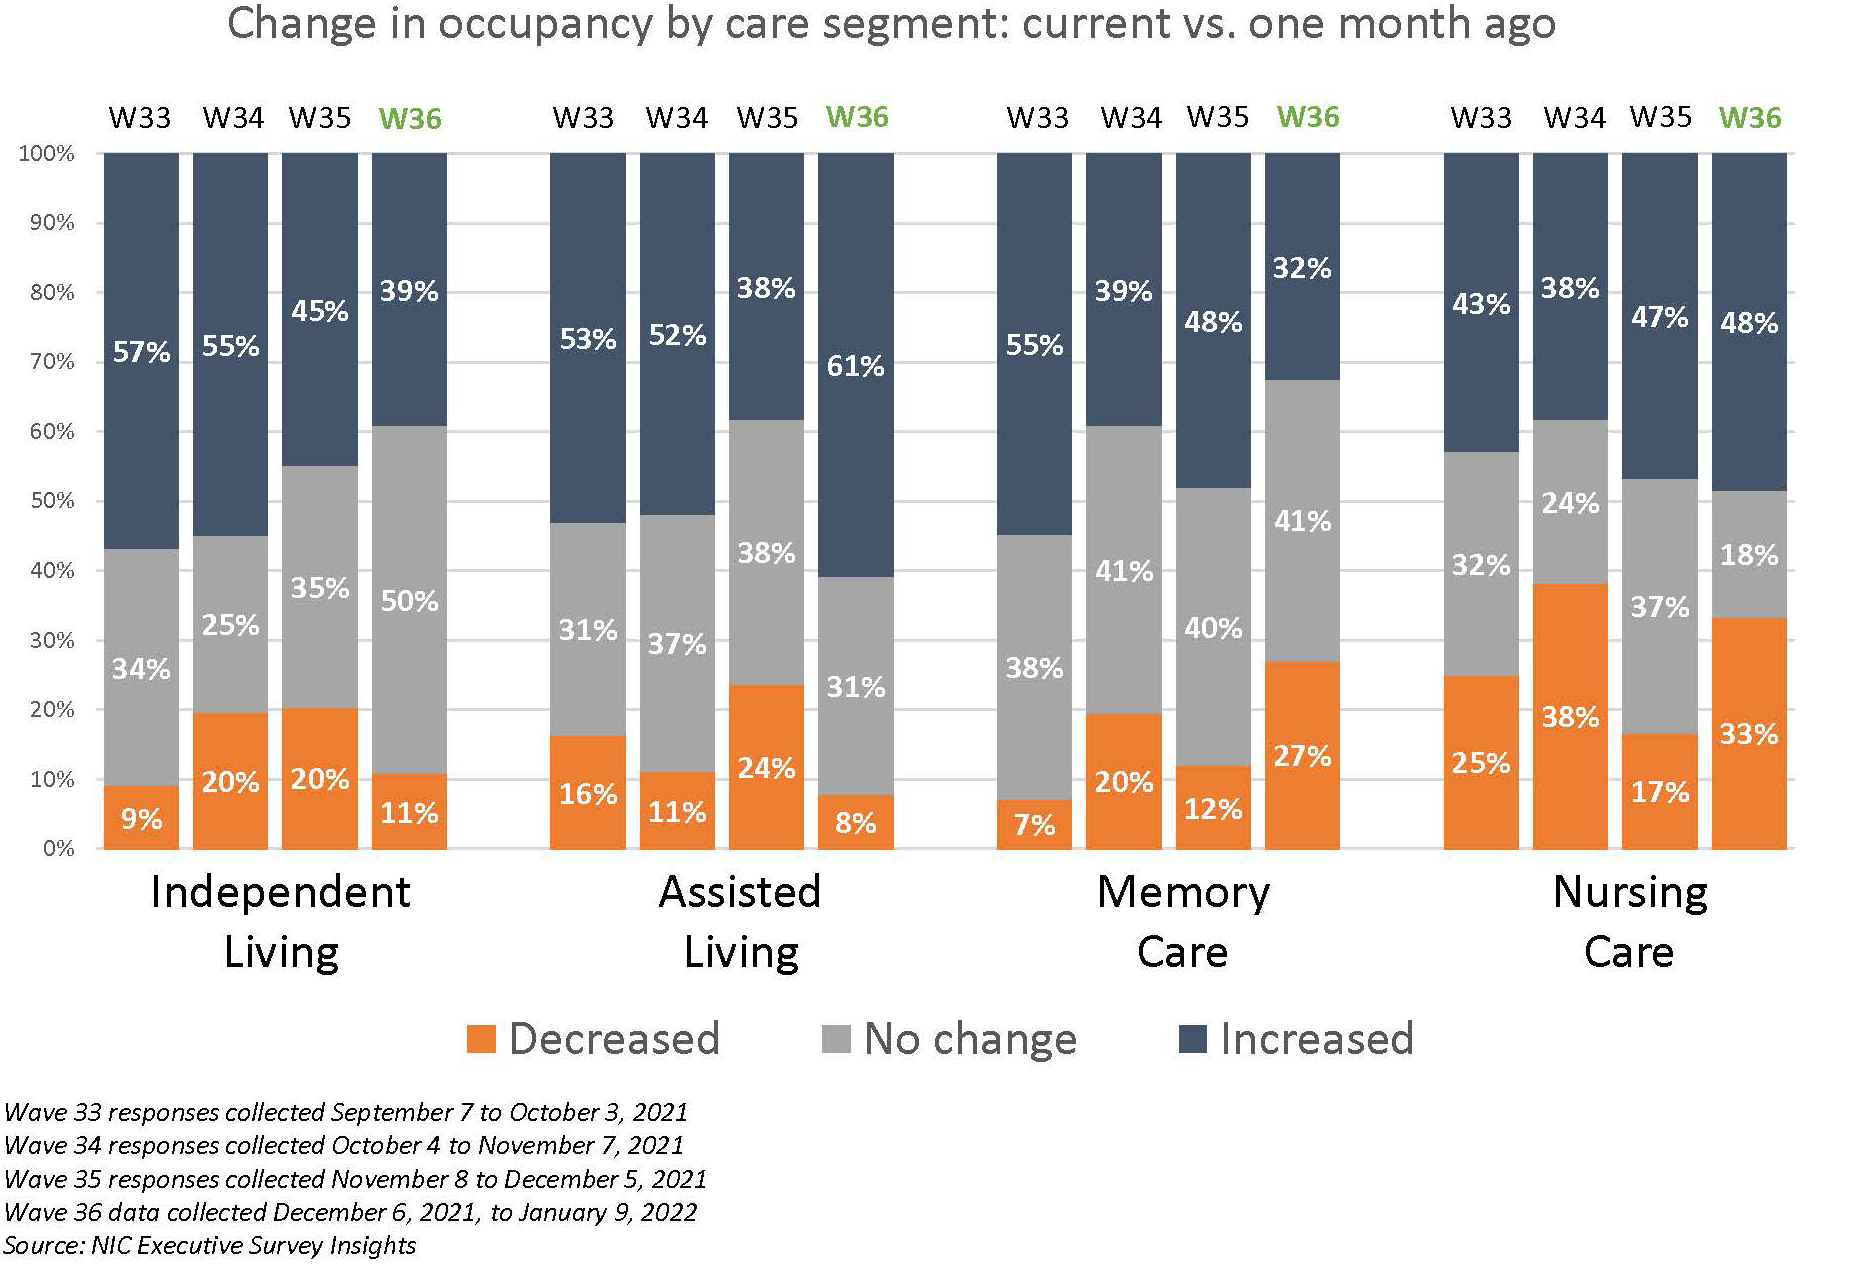
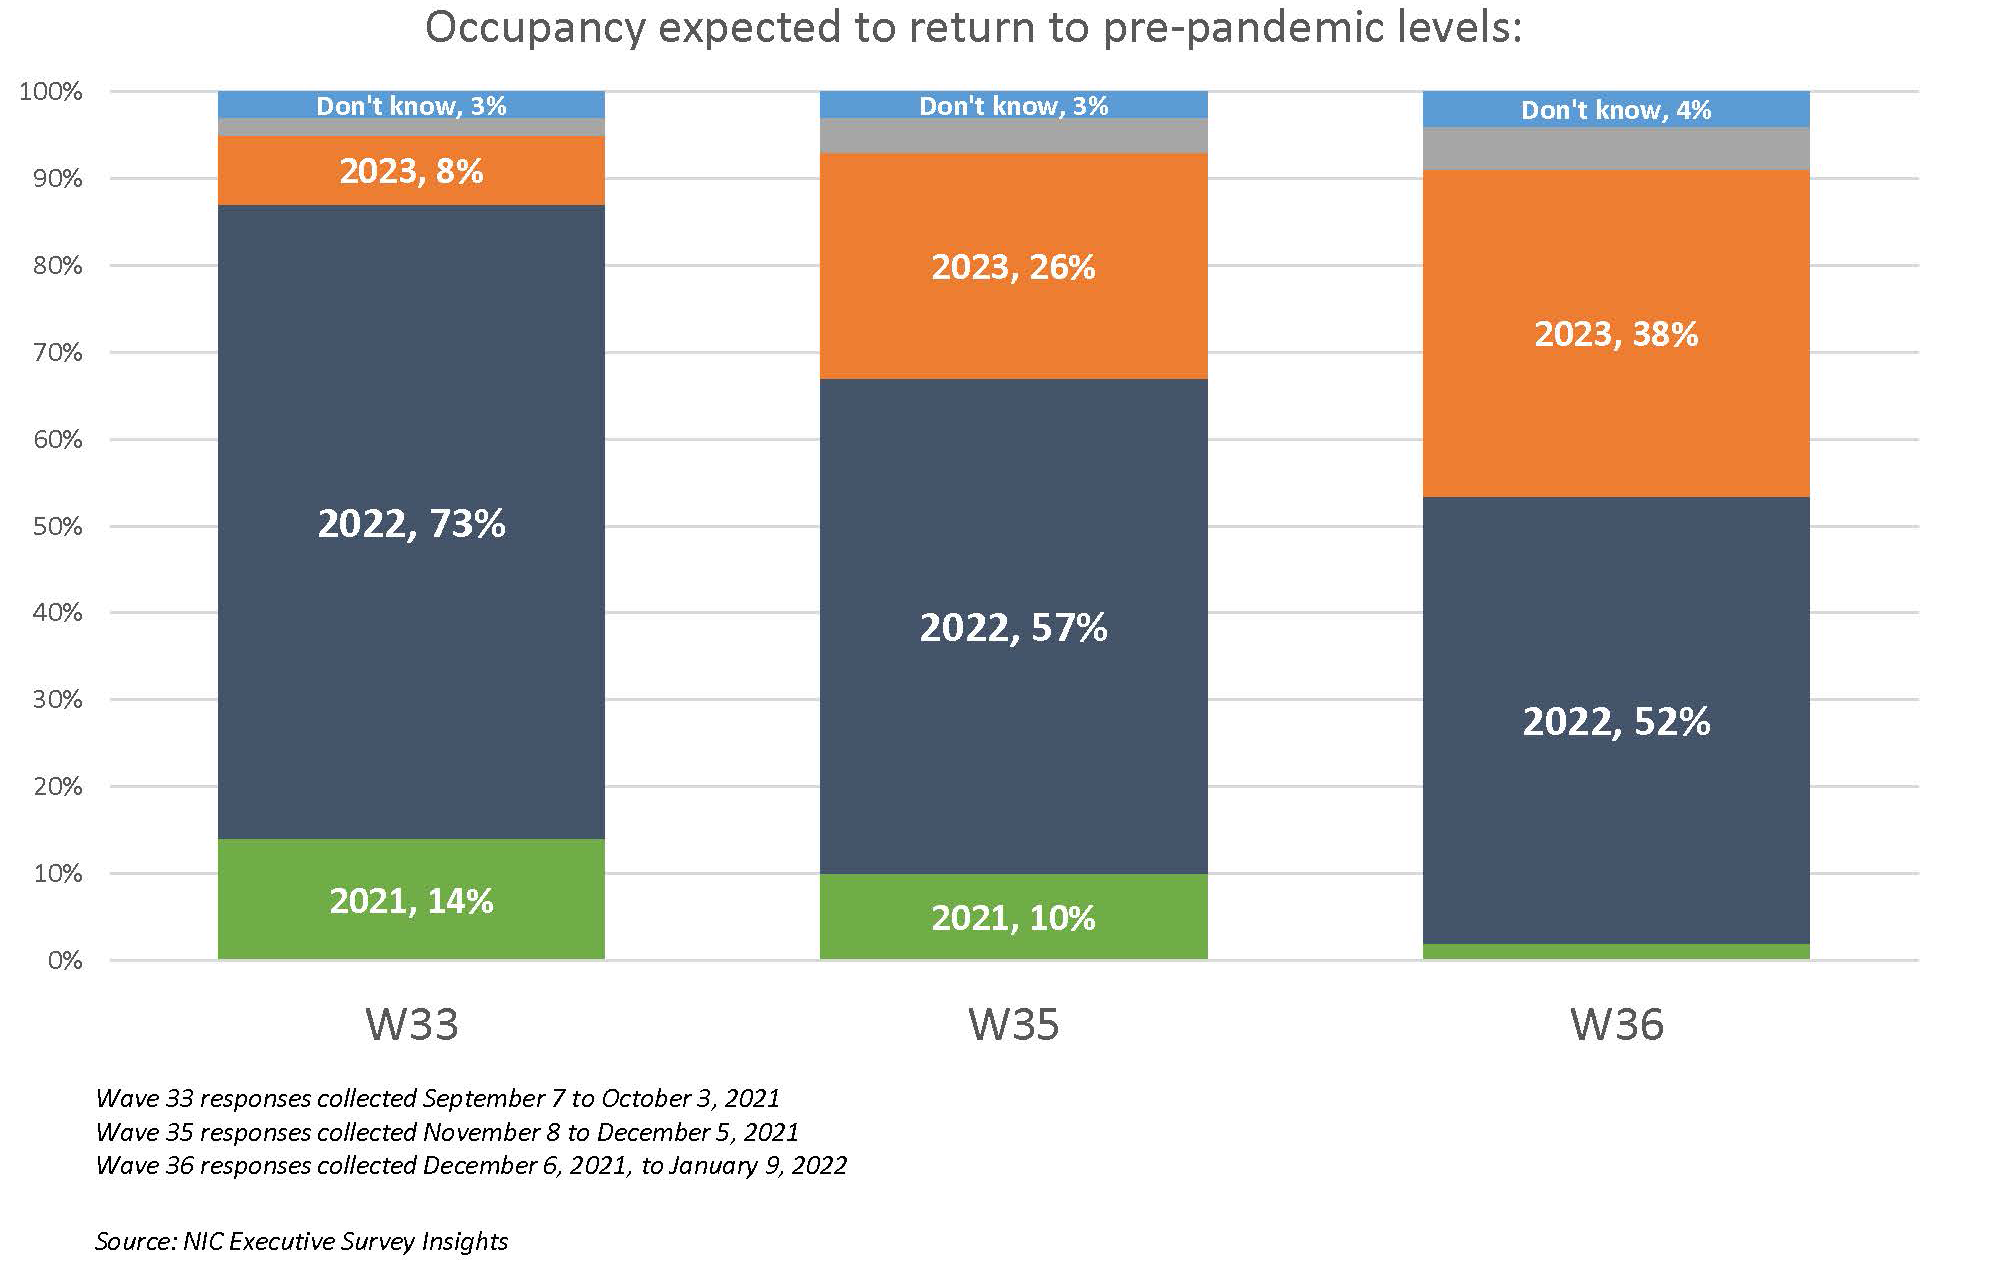
  • Between roughly 50% and 70% of organizations report an increase in occupancy in Wave 31, with the memory care segment showing the most improvement since the prior survey (68%). The share of organizations that expect their occupancy to return to pre-pandemic levels has remained consistent since the question was first asked in the latter half of February. Since then, nearly two out of three respondents (61%) anticipate their organization’s occupancy will rebound to pre-pandemic levels sometime in 2022.

  • During the Wave 31 survey data collection period (July 22 to August 8), several senior living companies—including some of the nation’s largest operators—have mandated the COVID-19 vaccine for employees. Additionally, major trade organizations AHCA/NCAL and LeadingAge and 56 healthcare groups recently urged vaccination requirements for all healthcare and long-term care employers. The chart below reflects the growing share of respondent organizations that will likely require the vaccine for their employees. (The Wave 32 survey asks respondents to indicate whether they have already made the vaccine mandatory.)

  • All respondents in the Wave 31 survey indicated their organizations were experiencing staffing shortages (100%). Among organizations with multiple properties, four out of five (80%) have staffing shortages in more than half of their properties—up from two-thirds (64%) in the Wave 29 survey conducted mid-May to mid-June.

  • A total of four out of five respondents indicated that attracting community and caregiving staff (51%) and staff turnover (30%) were the biggest challenges facing their organizations today. Roughly three-quarters (72%) indicated that increasing wages was the most effective tactic.

  • All respondents are currently paying staff overtime hours (100%) up from a low of 76% in the Wave 13 survey conducted in early-October 2020. Furthermore, four out of five organizations are currently tapping agency/temp staff (84%)—a time series high. One out of five (21%) are hiring staff from other industries similar to the Wave 3 survey conducted in mid-April 2020.

  • With outlook that has remained generally unchanged since last summer, one-third of respondents (30%) in Wave 31 expect an increase in their development pipelines going forward. Among those who expect their development pipelines to increase, reasons such as current and future market demand, and continuation of expansion plans prior to the pandemic were cited most frequently.

Wave 31 Survey Demographics

Responses were collected between July 12 to August 8, 2021, from owners and executives of 70 seniors housing and skilled nursing operators from across the nation. Owner/operators with 1 to 10 properties comprise roughly two-thirds (63%) of the sample. Operators with 11 to 25 and 26 properties or more make up 19% of the sample, respectively.

  • Approximately one-half of respondents are exclusively for-profit providers (54%); more than one-third operate not-for-profit (38%) and 8% operate both.
  • Many respondents in the sample report operating combinations of property types. Across their entire portfolios of properties, 70% of the organizations operate seniors housing properties (IL, AL, MC), 34% operate nursing care properties, and 33% operate CCRCs (aka Life Plan Communities).

Owners and C-suite executives of seniors housing and care properties, please help us tell an accurate story about our industry’s performance.

The current survey is available and takes under ten minutes to complete. If you are an owner or C-suite executive of seniors housing and care and have not received an email invitation to take the survey, please contact Lana Peck at lpeck@nic.org to be added to the list of recipients.

NIC wishes to thank survey respondents for their valuable input and continuing support for this effort to bring clarity and create a comprehensive and honest narrative in the seniors housing and care space at a time when trends are continuing to change in our sector.

Skilled Nursing Occupancy Increases Further in May 2021

NIC MAP® Data Service powered by NIC MAP Vision released its latest Skilled Nursing Monthly Report on August 5, 2021, which includes key monthly data points from January 2012 through May 2021.


Medicare RPPD down 2.4% from the high set in June 2020.

NIC MAP® Data Service, powered by NIC MAP Vision, released its latest Skilled Nursing Monthly Report on August 5, 2021, which includes key monthly data points from January 2012 through May 2021.

Below are some key takeaways from NIC Analytics regarding the data.

Skilled nursing property occupancy increased for a fourth consecutive month in May, albeit at a slower pace than recent monthly gains, rising 23 basis points from April to 73.4%. This placed it 211 basis points above the low point reached in January 2021. There is cautious optimism for increased occupancy through 2021, although recent news about the rapid spread of the contagious COVID-19 Delta variant is concerning. That said, the skilled nursing industry is still challenged by very low occupancy and the fact that government stimulus funds may be exhausted soon unless additional funds are provided. Hence, the question remains as to how fast the industry can increase occupancy to a sustainable level. It remains very low compared to February 2020 pre-pandemic levels of 85.5% (12.0 percentage points).

SNF Occupancy May 2021

Medicaid revenue per patient day (RPPD) decreased $2 from April to end May 2021 at $241. Medicaid RPPD continued its recent decline after hitting a high of $244 in February. However, the latest monthly data in May still represents a 3.3% increase from pre-pandemic levels of February 2020 ($233). Medicaid reimbursement has increased more than usual as many states embraced measures to increase reimbursement related to the number of COVID-19 cases. On the other hand, covering the cost of care for Medicaid patients is still a major concern as reimbursement does not cover the cost in many states. In addition, nursing home wage growth is elevated relative to inflation and staffing shortages are a significant challenge in many areas of the country.

Medicare revenue per patient day (RPPD) declined slightly from April to end May 2021 at $559. In a similar trend to Medicaid, the Medicare RPPD continued to decline after hitting a high during the initial wave of COVID-19. There was support from the federal government to aid Medicare fee-for-service reimbursements for situations such as providing higher rates to help care for COVID-19 positive patients requiring isolation. RPPD has now declined, and one possible reason is lower property-level case counts. Medicare RPPD has decreased 2.4% from the high set back in June 2020.

SNF RPPD May 2021

Managed Medicare revenue mix held relatively steady from April to May at 10.8%. It has declined since its recent high of 11.2% in February but was up by 250 basis points from the pandemic low set in May 2020 of 8.3%. The increase is likely due to growth in elective surgeries from the prior year. Meanwhile, Medicare revenue mix continues to decline, falling 58 basis points from April to end May at 20.4%, a time-series low. It has been falling since January 2021 when it was 25.2%, the time of peak COVID-19 cases.   The downward trend is likely due to less utilization of the 3-Day Rule waiver, which was implemented to keep COVID-19 positive patients from having to go back to the hospital.


To get more trends from the latest data you can download the Skilled Nursing Monthly Report here. There is no charge for this report.

The report provides aggregate data at the national level from a sampling of skilled nursing operators with multiple properties in the United States. NIC continues to grow its database of participating operators in order to provide data at localized levels in the future. Operators who are interested in participating can complete a participation form at https://www.nic.org/skilled-nursing-data-initiative. NIC and NIC MAP Vision maintain strict confidentiality of all data they receive.


Interested in learning more about NIC MAP data? To learn more about NIC MAP data, powered by NIC MAP Vision, and about accessing the data featured in this article, schedule a meeting with a product expert today.

Much Attention to Strong July Employment Report: Jobs Up by 943,000

The Labor Department reported that nonfarm payrolls rose by a strong 943,000 in July 2021 and an upwardly revised 938,000 in June. The consensus estimates for July had been for a gain of 858,000. Nonfarm payrolls are now up by 16.7 million since April 2020 but remain down by 5.7 million or 3.7% from pre-pandemic levels of February 2020.

The Labor Department reported that nonfarm payrolls rose by a strong 943,000 in July 2021 and an upwardly revised 938,000 in June. The consensus estimates for July had been for a gain of 858,000. Nonfarm payrolls are now up by 16.7 million since April 2020 but remain down by 5.7 million or 3.7% from pre-pandemic levels of February 2020. The data show that the U.S. recovery from the pandemic remains in place and that the hindrance on hiring from labor shortages may be easing. Its noteworthy, however, that the data collection period for the July report occurred in the first half of the month, prior to growing concerns about the COVID-19 Delta variant.

Today’s report is especially important as the Federal Reserve wants to see “substantial progress” in the economy before it shifts monetary policy to a tighter regime of higher interest rates and fewer asset purchases.   The July jump in jobs along with the significant upward revisions in June and May payrolls point to an improving labor market, a key consideration for the Fed in evaluating “substantial progress”. Further, the 4.0% annual increase in average hourly earnings will fuel concerns about inflation.

Indeed, average hourly earnings for all employees on private nonfarm payrolls rose by $0.11 in July to $30.54, a gain of 4.0% from a year earlier, up from 3.7% in June. The data suggests that rising demand for labor associated with the recovery from the pandemic is putting upward pressure on wages. That said, the Labor Department warns that the pandemic has affected the ability to fully interpret the wage data due to the wide swings in employment trends. 

Notable job gains occurred in leisure and hospitality (380,000), local government (221,000), and professional and business services (60,000). Health care added 37,000 jobs in July. Job gains in ambulatory health care services (32,000) and hospitals (18,000) more than offset a loss of 13,000 jobs in nursing and residential care facilities. Health care employment is down by 502,000 since February 2020.  

Separately and from a different survey, the Labor Department reported that the unemployment rate fell by 0.5 percentage point to 5.4% in July and the number of unemployed persons fell by 782,000 to 8.7 million. The jobless rate is now 1.6 percentage points above the pre-pandemic level of 3.5% seen in February 2020, but well below the 14.7% peak seen in April 2020. The underemployment rate or the U-6 jobless rate was 9.2% down from 9.8% in June 2021. This figure includes those who have quit looking for a job because they are discouraged about their prospects and people working part-time but desiring a full work week.  

The number of long-term unemployed (those jobless for 27 weeks or more) decreased by 560,000 to 3.4 million but is 2.3 million higher than in February 2020, suggesting that this continues to be a very challenging time for many Americans. Long-term unemployed persons account for 39.3% of the total number of unemployed persons.

The labor force participation rate, which is a measure of the share of working age people who are employed or looking for work was steady at 61.7% in July and has remained within a narrow range of 61.4% to 61.7% since June 2020. The participation rate is 1.6 percentage points lower than in February 2020. Many workers have dropped out of the labor force since the pandemic began to take care of family members or out of fear of working and catching the virus.  

The change in total nonfarm payroll employment for May was revised up by 31,000 from a gain of 583,000 to 614,000 and the change for June was revised up by 88,000 from 850,000 to 938,000. With these revisions, employment in May and June combined is 119,000 higher than previously reported. Monthly revisions result from additional reports received from businesses and government agencies since the last published estimates and from the recalculation of seasonal factors.