2017 Transaction Volume Down Slightly From 2016

The 2017 preliminary closed transactions data is in and it shows a slight decline in dollar volume compared to 2016. Seniors housing and care closed transaction volume in 2017 registered $14.1 billion, which included relatively weak second and fourth quarter transaction volume. The $14.1 billion includes $7.9 billion in seniors housing and $6.2 billion in nursing care.  The total volume was down 2.8% from the previous year’s $14.5 billion, but down 35.5% from 2015 when volume came in at $21.9 billion.  If these figures hold as we finalize the 2017 numbers then it will be the lowest year in closed transactions volume since 2012.

If we take a deeper look at seniors housing and nursing care separately, we see that seniors housing volume was up but nursing care was down from 2016. Seniors housing saw a 4.5% increase in volume from $7.5 billion and nursing care was down 10.8% from $7.0 billion last year.

Comparing volume on a quarterly basis, seniors housing and nursing care in the fourth quarter of 2017 registered $2.1 billion which is down 37.6% from the $3.4 billion a year ago in the fourth quarter of 2016 and the lowest quarterly volume since the second quarter of 2013 which registered $1.7B. In comparison to the previous quarter, volume was down 59% as the third quarter of 2017 came in at $5.1 billion.  A large portion of that $5.1 billion in the third quarter was the $2.1 billion Sabra acquisition of Care Capital Properties. That $2.1 billion transaction was a main driver of the comparison decrease in nursing care volume in the fourth quarter as nursing care was down 64% from the third quarter. Seniors housing was down 50%.

Of the $2.1B in the fourth quarter of 2017, seniors housing made up $900 million and nursing care made up $1.2 billion.

As noted above, one of the weak quarters for closed transaction in 2017 was the fourth quarter. The fourth quarter is historically a strong quarter compared to the rest of the year.  However, in 2017 it represented the lowest in terms of dollar volume. Not only was the dollar volume the weakest in the fourth quarter, but the number of deals closed was also the smallest of the year, which is highly unusual.  Sometimes we’ve seen a very large deal closed within the year that skews the dollar volume in the first, second, or third quarter, but when looking at the absolute number of closed deals, you mostly see the fourth quarter as highly active.  Of course, one main reason for this could be the wait-and-see approach as the tax overhaul was unfolding as 2017 came to a close. Time will tell if deals were delayed into the first quarter of 2018, or perhaps the second quarter.

Smaller Transactions Dominate

Continuing further analysis when it comes to the number of deals closed, a measure different than dollar volume, we saw the number of transactions closed drop 17%.  According to preliminary data, the number of deals closed in 2017 was 446 of which 90 were portfolio transactions and 356 single property transactions. That compares to 538 transactions closed in 2016 of which 109 were portfolio and 429 were single property transactions.  Over the past couple years portfolio transactions represented 20% of overall closed transactions.  This was even the case back in 2015 when the public buyer type, namely the publicly traded REITs, represented the majority share of buyers. Indeed, single property transactions are very important to the market in terms of the flow of transactions closing, not necessarily the dollar volume each quarter.

As the single property transactions market has been strong, we had seen 16 straight quarters of over 100 total deals close, up until the fourth quarter of 2017.  The fourth quarter of 2017 only shows 84 closing so far.

As far as the size of the deals, small deals of $50 million or less dominated in the fourth quarter, more than usual, representing 95% of all deals closed.

Over the past couple years, as the public buyer type has become less representative of the overall volume, we have seen a significant decrease in large deals of $500 million or more.  In 2015, we saw 10 transactions of $500 million or more and only 9 transactions combined in 2016 and 2017.

Stay tuned for final 2017 figures coming in a February blog along with the latest on buyer composition.

Five Key Takeaways from NIC’s Fourth-Quarter 2017 Seniors Housing Data Release

NIC MAP® Data Service clients attended a webinar earlier this month on the key seniors housing data trends during the fourth quarter of 2017. Key takeaways included the following.

Takeaway #1:  Seniors housing occupancy was unchanged at 88.8%

The all occupancy rate for seniors housing, which includes properties still in lease up, was 88.8% in the fourth quarter, unchanged from the third quarter. This placed occupancy 1.8 percentage points above its cyclical low of 87.0%, reached during the first quarter of 2010, and 1.4 percentage points below its most recent high of 90.2% in the fourth quarter of 2014. For the year, 18,500 units were added to inventory compared with 12,200 units absorbed on a net basis. As a result, occupancy fell 70 basis points from the fourth quarter of 2016.

Takeaway #2:  Annual inventory growth and annual absorption for both assisted living and independent living flattened during the quarter

Assisted living inventory growth has been ramping up for a longer period than independent living in the primary markets. In mid-2012, the occupancy rate of independent living was nearly the same as for assisted living at 88.8%. Since that time, there has been a clear divergence in occupancy performance reflecting the differences in supply growth and demand for the two property types.

For majority independent living properties, inventory growth exceeded absorption by 60 basis points in the fourth quarter—2.1% versus 1.5%. The occupancy rate for majority independent living properties was 90.6% in the fourth quarter.  Annual inventory growth for majority assisted living properties was 4.6%, down a bit from the third quarter. Annual absorption slipped back to a pace of 3.6%. The occupancy rate for assisted living was 86.5% in the fourth quarter.

Key Takeaway #3:  Nearly one-third of seniors housing inventory growth in past three years occurred in eight metropolitan markets

During the past three years, there have been nearly 79,000 units added to the stock of seniors housing inventory among the primary and secondary markets. Nearly one-third of this growth occurred in eight metro areas: Dallas, Minneapolis, Chicago Atlanta, Houston, Boston, Phoenix, and New York. Dallas alone accounted for 5% of all new seniors housing inventory in the past three years.

Key Takeaway #4:  Same-store rent growth decelerated

Same-store asking rent growth for seniors housing slowed in the fourth quarter, with year-over-year growth of 2.6%. This was down from 3.7% in the fourth quarter of last year when it reached a cyclical peak, but was equal to its long-term average pace experienced since late 2006 of 2.6%.

Asking rent growth for majority assisted living properties was 2.7% in the fourth quarter, down 40 basis points from the third quarter. For majority independent living, rent growth remained at its third quarter pace of 2.4%, but was well below the 4.1% pace it achieved in the third quarter of 2016 when rent growth reached its highest pace since NIC began collecting this data.

There is wide variation in rent growth. Among the primary markets, the top ranked metropolitan areas for year-over-year rent growth in seniors housing were San Jose, Seattle, Los Angeles, Las Vegas and Portland, Oregon. The weakest rent growth was in Kansas City, Atlanta, Chicago and San Antonio. Many of these latter markets also had some of the lowest fourth quarter occupancy rates in the nation.

Key Takeaway #5:  Seniors Housing Ranks High in 2018 Emerging Trends Real Estate ® 

  • Lastly, it’s notable that seniors housing is getting more attention from the investment community. In the recently released 2018 Emerging Trends in Real Estate®, produced jointly by PwC and the Urban Land Institute, seniors housing ranks high for best prospects in 2018 for both investment and development. According to the annual survey’s U.S. respondents, seniors housing ranked:
    • Third among all 24 commercial and multifamily subsectors, and
    • First among the 7 residential property types.
  • The report further highlights the strength of seniors housings’ investment returns and its rising liquidity based on sales transactions volumes. These survey results bode well for continued interest among investors and developers in seniors housing properties going forward.

2018 NIC Spring Investment Forum to Highlight Industry Challenges and the Opportunities to Benefit from Coordinated Care

The seniors housing, long-term care, acute care, and post-acute care sectors face significant challenges. Amongst these are navigating markets amid new competition and providing services cost-effectively as the healthcare delivery and payments system undergoes dramatic change. The rules of the game are changing as higher acuity patients increase, and the pressure to decrease healthcare costs continues to escalate.

However, with challenges come opportunities for growth and innovation. These opportunities will be explored at the upcoming 2018 NIC Spring Investment Forum, to be held at the Omni Dallas Hotel March 7-9.

The Forum, which draws over 1,500 attendees, is the only conference that brings together leaders in seniors housing, skilled nursing, healthcare, home health and home care, finance, and care coordination to share game-changing ideas and cutting-edge success strategies.  As most in the sector will attest, it’s a “must-go” event for those who don’t want to miss out on ideas to benefit from coordinated care or the opportunity to develop profitable partnerships.

The theme of the three-day event is “Unlocking New Value in Senior Care Collaboration.”  Each day offers networking and education opportunities, including two general sessions, 17 educational breakout sessions, ample meeting areas, and nightly events.

The two general sessions are designed to put current industry trends in context.  The opening general session will feature an in-depth look at the disruption in healthcare payment and delivery and its impact on seniors housing, post-acute and long-term care. The general session luncheon will include a discussion by industry leaders on investment strategies in the age of disruption.

The educational breakout sessions will be divided into three special focus areas:

Investing & Valuations: Sessions will include a discussion with equity players in real estate and service business platforms, a review of local market performance, an update on valuation methodology, a deep dive on current market conditions, a discussion of debt financing for real estate and cash flow businesses, and a look at who will take care of all the Baby Boomers.

Value Creation & Partnerships: These sessions will cover how to achieve successful care coordination, how to partner in a value-based world, the secrets to winning managed care business, a skilled nursing survival guide, what investors need to know about healthcare and why it’s important, why scale is leverage, and how to integrate care services.

Risk & Return: Sessions will include how to take on the risk for healthcare outcomes in a changing environment, why some companies are choosing not to take on risk, why and how some care providers are taking the insurer’s path to healthcare risk, and the strategies for taking on Medicaid long-term care risk.

Here’s who can benefit from attending:

  • Seniors housing and skilled nursing operators and investors who want to position their organization to succeed and benefit financially from the transformation of the fee-for-service system
  • Home health and home care providers who want to meet and engage with senior care operators who need the capabilities and services offered
  • Healthcare providers and payers who want to gain insights into the best strategies to improve outcomes and reduce costs in post-acute and long-term care

Don’t miss out on the opportunity to connect, network and explore the innovative ways to benefit from coordinated care and cross-sector partnerships.

Registration is now open. Click here to register.

Watch conference highlights

2017: The Year of Deregulation for the Skilled Nursing Industry

On Christmas Eve, the New York Times published an article describing measures the Centers for Medicare and Medicaid (CMS) took during 2017 to reduce fines levied against skilled nursing properties. The skilled nursing industry may view this change as a welcome respite from real or perceived government over-regulation, especially in an era of downward pressure on occupancy and constrained budgets. Nursing home resident advocates, on the other hand, may view this move as an affront to resident safety. Deregulation remains a top priority for President Trump, and therefore efforts to reduce penalties for nursing homes should not come as a surprise.

Jordan Rau, author of the Times’ expose, cites several memos from CMS in his analysis of fewer and less severe fines for skilled nursing providers. The first was released in July, 2017. The memo explains revisions to the analytic tool used by CMS Regional Offices to determine the Civil Monetary Penalty (CMP) to be imposed on a nursing home found to be in violation of federal regulations. The impetus for the revisions, according to the CMS memo, is to reduce variation across facilities. The most impactful change resulting from this new guidance is the limitation of daily fines, which may now only be imposed on nursing homes if the violation is discovered during an active survey, which occurs about once per year. Violations occurring prior to the survey visit would only result in a one-time fine. Both daily and per instance fines “are intended to promote a swift return to substantial compliance for a sustained period of time, preventing future noncompliance,” the memo states.

The second set of guidelines issues by CMS came in October, 2017. This memo makes explicit revisions to the State Operations Manual, which instructs officers on the imposition of CMPs and other remedies for nursing homes found to be in violation of federal regulations. The revision to the manual reiterates the guidance in the July memo, stating: This guidance does not apply to past noncompliance deficiencies […]. The determination to impose federal remedies for past noncompliance is at the discretion of the CMS Regional Office. The gist of the revisions is to discourage the imposition of fines on nursing homes where a violation appears to be a one-time offense, rather than an on-going problem.

The final memo issues in 2017 delays the enforcement of violations related to Phase 2 requirements. Properties found to be noncompliant with certain regulations related to the updated Requirements for Participation rules issued in 2016 will not be fined for 18 months. The regulations remain in place and surveyors are instructed to note citations, but fines will not be imposed. Furthermore, facilities’ five-star scores will not be impacted by violations on the survey that occur between November 2017 and November 2018. Again, violations will be reported, but the five-star score will not be adjusted as a result of those violations.

These measures to deregulate the skilled nursing industry may be a welcome respite for operators. Indeed, David Gifford, senior vice president for quality for the American Health Care Association, said, “What was happening is you were seeing massive fines accumulating because they were applying them on a per-day basis retrospectively.” In March, AHCA wrote in a letter to then-Secretary of Health and Human Services Tom Price, “The use of CMPs is out of control.” AHCA contends that a financial penalty should not be used as a punishment but as a corrective measure, which the July memo apparently agrees with. A recent example of how steep penalties can be occurred in Pennsylvania, where a single facility was fined almost $800,000 in a single year for two major violations.

Not unexpectedly, many advocates for nursing home residents have expressed disappointment in this rollback of regulations. Following the New York Times article, opinion pieces cropped up in Mother Jones, Bustle, and the Minnesota Star Tribune expressing opposition to deregulation of the nursing home industry. Even former CMS administrator Andy Slavitt tweeted about his opposing view, citing the Times article. The timing of the article, published on the day after Christmas, may have served to limit the amount of public backlash to which nursing homes are often subject in the news.

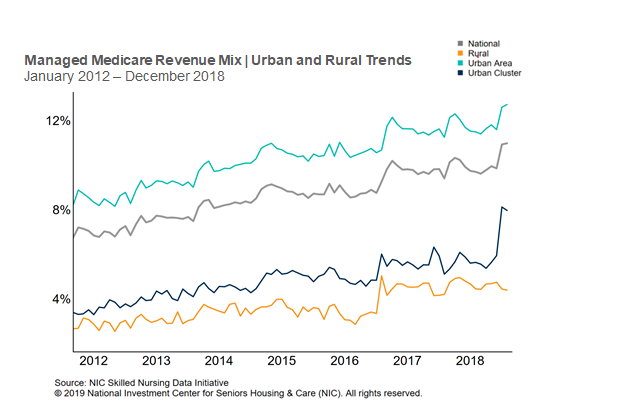
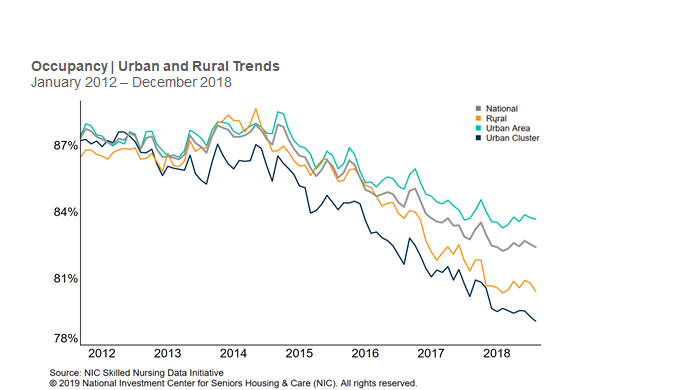
The bottom line for operators is that they can expect to face fewer financial penalties this year than in previous years for violations on the survey. Five-star scores could still change, but will not change as a result of violations for the new regulations from Phase 2 of the Requirements of Participation. At a time when consistent downwardz pressure on occupancy continues to plague nursing home operators (see NIC’s 3Q2017 Skilled Nursing Data Report), a reduction in fines may be welcome. Providers will likely continue to focus on improving quality, as other levers reinforce the importance of quality.  This includes competition for managed Medicare contracts and benefits for 3-star-and-above facilities. Because the Trump administration has been rolling back regulations across the federal government and CMS Director Seema Verma’s background in drafting CMS waivers and expressed interest in giving states more flexibility, even more federal measures to deregulate the industry could occur in 2018.


U.S. economy created 148,000 jobs in December 2017

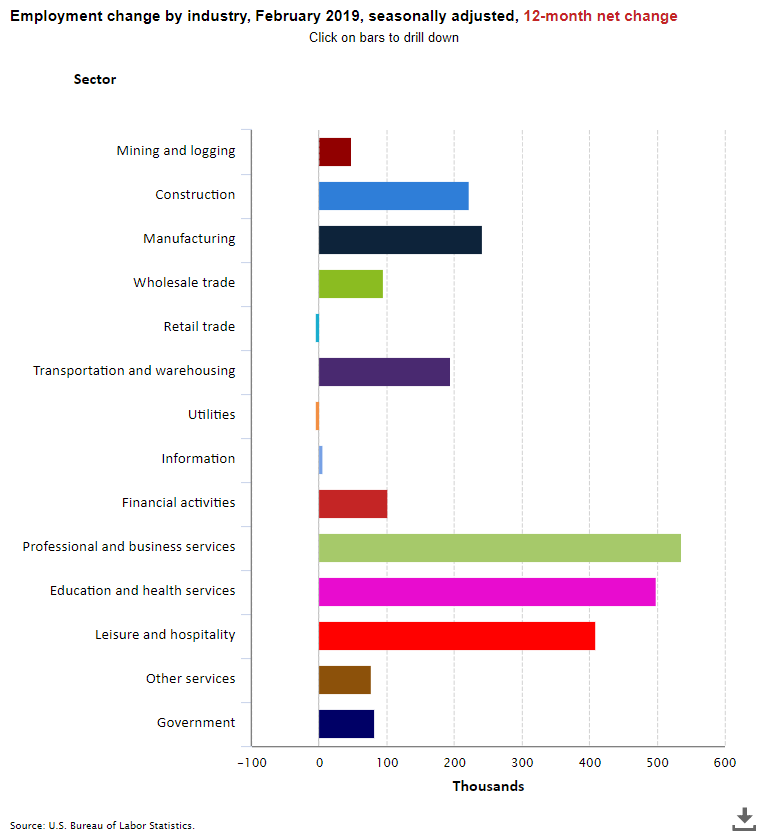
The Labor Department reported that there were 148,000 jobs created in the U.S. economy in December.   This was below the consensus expectation of 190,000 jobs.  This marked the 87th consecutive month of positive job gains for the U.S. economy.  Revisions subtracted 9,000 jobs to the prior two months.  For all of 2017, the economy generated 2.1 million jobs and averaged 171,000 per month.  This marks the second time on record that the economy has created at least 2 million jobs a year for seven consecutive years (the first time was in the 1990s). The 2.1 million increase was the smallest since 2010, however.

Health care added 31,000 jobs in December. Health care added an average of 300,000 jobs in 2017, down from 379,000 in 2016.

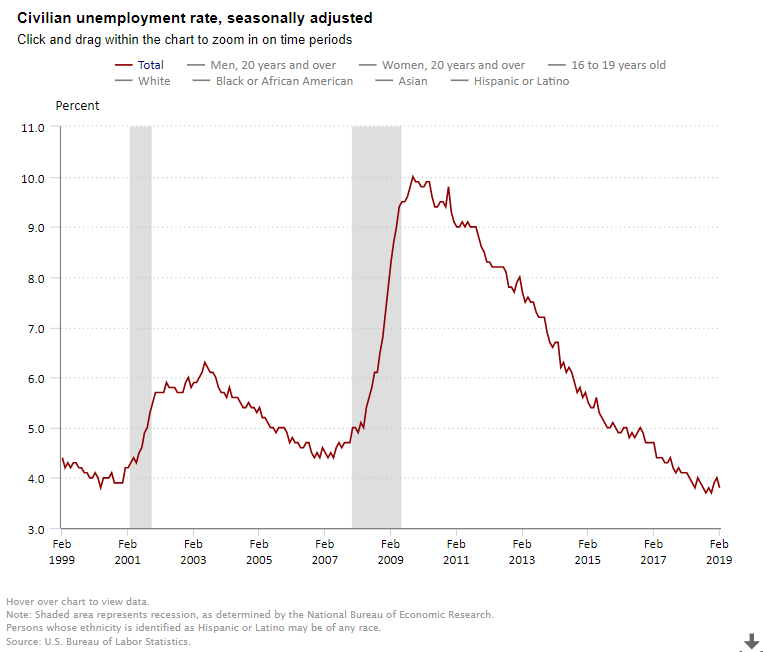
The unemployment rate remained unchanged for the third consecutive month at a 17-year low of 4.1% in December. This is below the rate of what the Federal Reserve believes is the “natural rate of unemployment” and suggests that there should be upward pressure on wage rates.

Average hourly earnings for all employees on private nonfarm payrolls rose in November by nine cents to $26.63. Over the past 12 months, average hourly earnings have increased by 65 cents, or 2.5%. This is down from the 2.6% average in 2016.  In 2015 this figure was 2.3% and in 2014, it was 2.1%.

Over the course of the year, the jobless rate fell 0.6 percentage points.  The trend in monthly payroll employment gains would have to drop to less than 100,000 per month to stop the ongoing downward trend in the unemployment rate from continuing.  In annual revisions to data based on the household survey, the unemployment rate for June 2017 was lowered to 4.3% from 4.4%; rates for other months during the year were unrevised.

The number of long-term unemployed (those jobless for 27 weeks or more) was little changed at 1.5 million and accounted for 22.9% of the unemployed. Over the year, the number of long-term unemployed was down by 354,000.  A broader measure of unemployment, which includes those who are working part time but would prefer full-time jobs and those that they have given up searching—the U-6 unemployment rate—increased to 8.1% in December from 8.0% in November, but was down from 9.2% as recently as last December.

The labor force participation rate, which is a measure of the share of working age people who are employed or looking for work remained at 62.7%.  This measure has generally been very low by historic standards, at least partially reflecting the effects of retiring baby boomers.

Today’s report will support expected increases in interest rates through 2018 by the Federal Reserve, with the first 25 basis point increase likely happening in March 2018.  The Fed has raised rates by a quarter percentage point five times since late 2015, and most recently to a range between 1.25% and 1.50% in December 2017, after keeping them near zero for seven years.