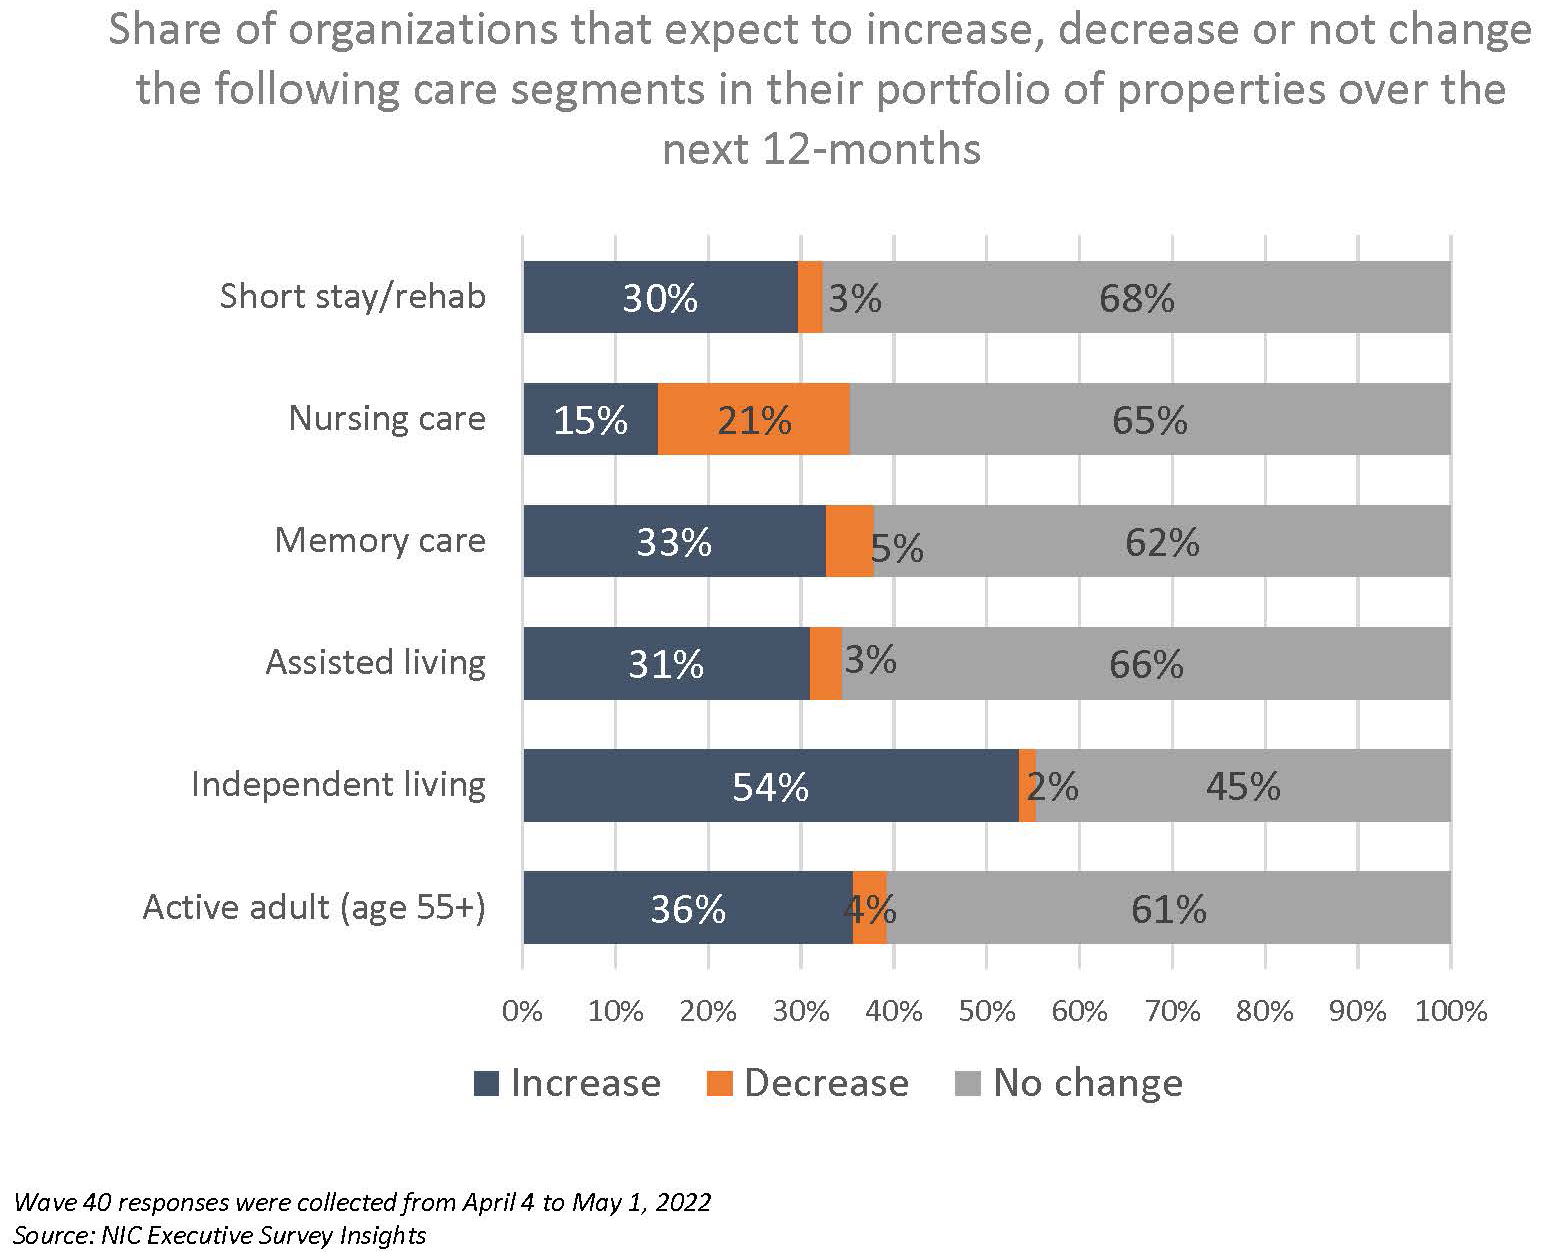
In a new question in the Wave 40 survey, respondents were asked whether they planned to increase, decrease, or not change their current care offering unit mix. Significantly, one-half of organizations expect to increase the independent living care segment over the next 12-months. On the flip side, one out of five respondents (21%) expect to decrease the nursing care segment. Regarding the current share of all full-time open positions across respondent organizations, in the Wave 40 survey, one-quarter have more than 20% of positions currently unfilled. Some innovative methods that have successfully recruited non-caregiving staff include quick hires with orientation scheduled several times during the week, educational incentives, directly recruiting in-person at nearby businesses, and more. The shares of organizations reporting acceleration in nursing care move-ins increased significantly—from 21% in Wave 37 conducted in January to 63% in Wave 40. One-half of respondents to the Wave 40 survey (52%) reported lead volumes above pre-pandemic levels in April—a notable increase from the Wave 38 survey reflecting results in February (33%). However, expectations for occupancy to recover to pre-pandemic levels in the near term have tempered over the past year. One-half of organizations currently expect occupancy recovery to occur in 2023, with the majority expecting it to happen in the first half of 2023.
–Lana Peck, Senior Principal, NIC
NIC’s Executive Survey of senior housing and skilled nursing operators was implemented in March 2020 to deliver real-time insights into the impact of the pandemic and the pace of recovery. In its third year, the “ESI” is transitioning away from the COVID-19 crisis to focus on timely industry topics. While some standard questions will remain for tracking purposes, in each new survey “wave,” fresh questions may be added.
This Wave 40 survey includes responses from April 4 to May 1, 2022, from owners and executives of 65 small, medium, and large senior housing and skilled nursing operators across the nation, representing hundreds of buildings and thousands of units across respondents’ portfolios of properties. More detailed reports for each wave of the survey and a PDF of the report charts can be found on the NIC COVID-19 Resource Center webpage under Executive Survey Insights.
In a new question included in the Wave 40 survey, respondents were asked whether they planned to increase, decrease, or not change their current care offering unit mix—some, or all of which may already be in the development pipeline. Significantly, one-half of organizations expect to increase the independent living care segment over the next 12-months. Of note, one out of five respondents (21%) expect to decrease the nursing care segment.
In the Wave 40 survey, three-quarters of respondents indicated the severity of their staffing shortages across their organizations was moderate (73%). Fewer respondents reported severe staffing shortages in the Wave 40 survey than in Wave 39 (19% vs. 27%). Attracting community and caregiving staff continues to be among operators’ most significant challenges, followed by rising operating expenses (89% and 80%, respectively).
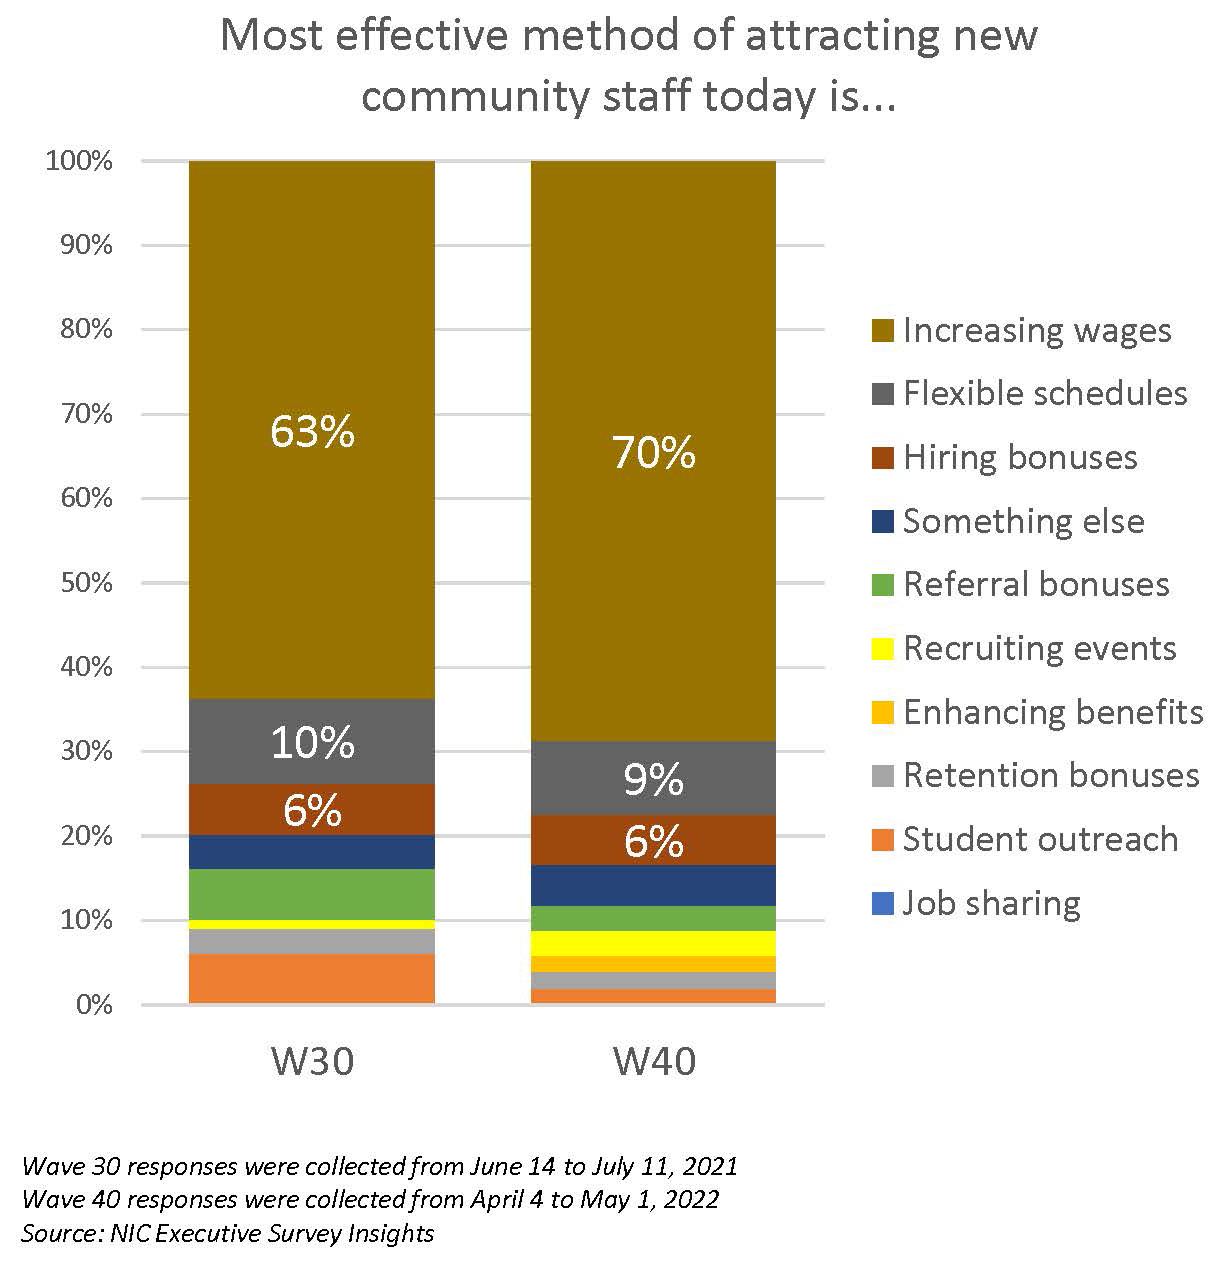
Regarding the most effective methods respondents have found for attracting new employees, increasing wages remain the most often cited. Comparing the Wave 30 survey conducted in June/July 2021 and the Wave 40 survey, 63% to 70% indicated that increasing wages continues to be the most effective.
With regard to the current share of all full-time, open positions across respondent organizations, in the Wave 40 survey, one-quarter have more than 20% of positions currently unfilled. One-half have between 11% and 20% of full-time positions unfilled.
In the Wave 39 survey, respondents were asked to share innovative methods they had found to be particularly successful in recruiting caregiving staff. In the Wave 40 survey, they were asked about innovative ways of recruiting non-caregiving staff. Beyond generally increasing wages, offering flexible schedules, hiring, and referral bonuses—all of which have been reported as effective to some degree—the list below includes alternative ways to attract non-caregiving staff as cited by respondents:
- Quick hires with orientation scheduled several times during the week.
- Quarter for quarter raise structure; all hourly employees receive a $.25 raise each quarter they stay with us.
- Directly recruiting in-person at nearby businesses.
- Attempting a daily pay option as a test to see if it has value as an incentive to staff.
- Opportunities to grow in position by providing educational incentives.
- Use of social media has had the most impact for us.
The timeline below shows the share of organizations reporting an increase in the pace of move-ins during the prior 30-days. Data from the Wave 40 survey reflects an increase in the share of operators reporting acceleration in the pace of move-ins after COVID-19 variant cases declined sharply in the U.S. Note that seasonality also may have an effect.
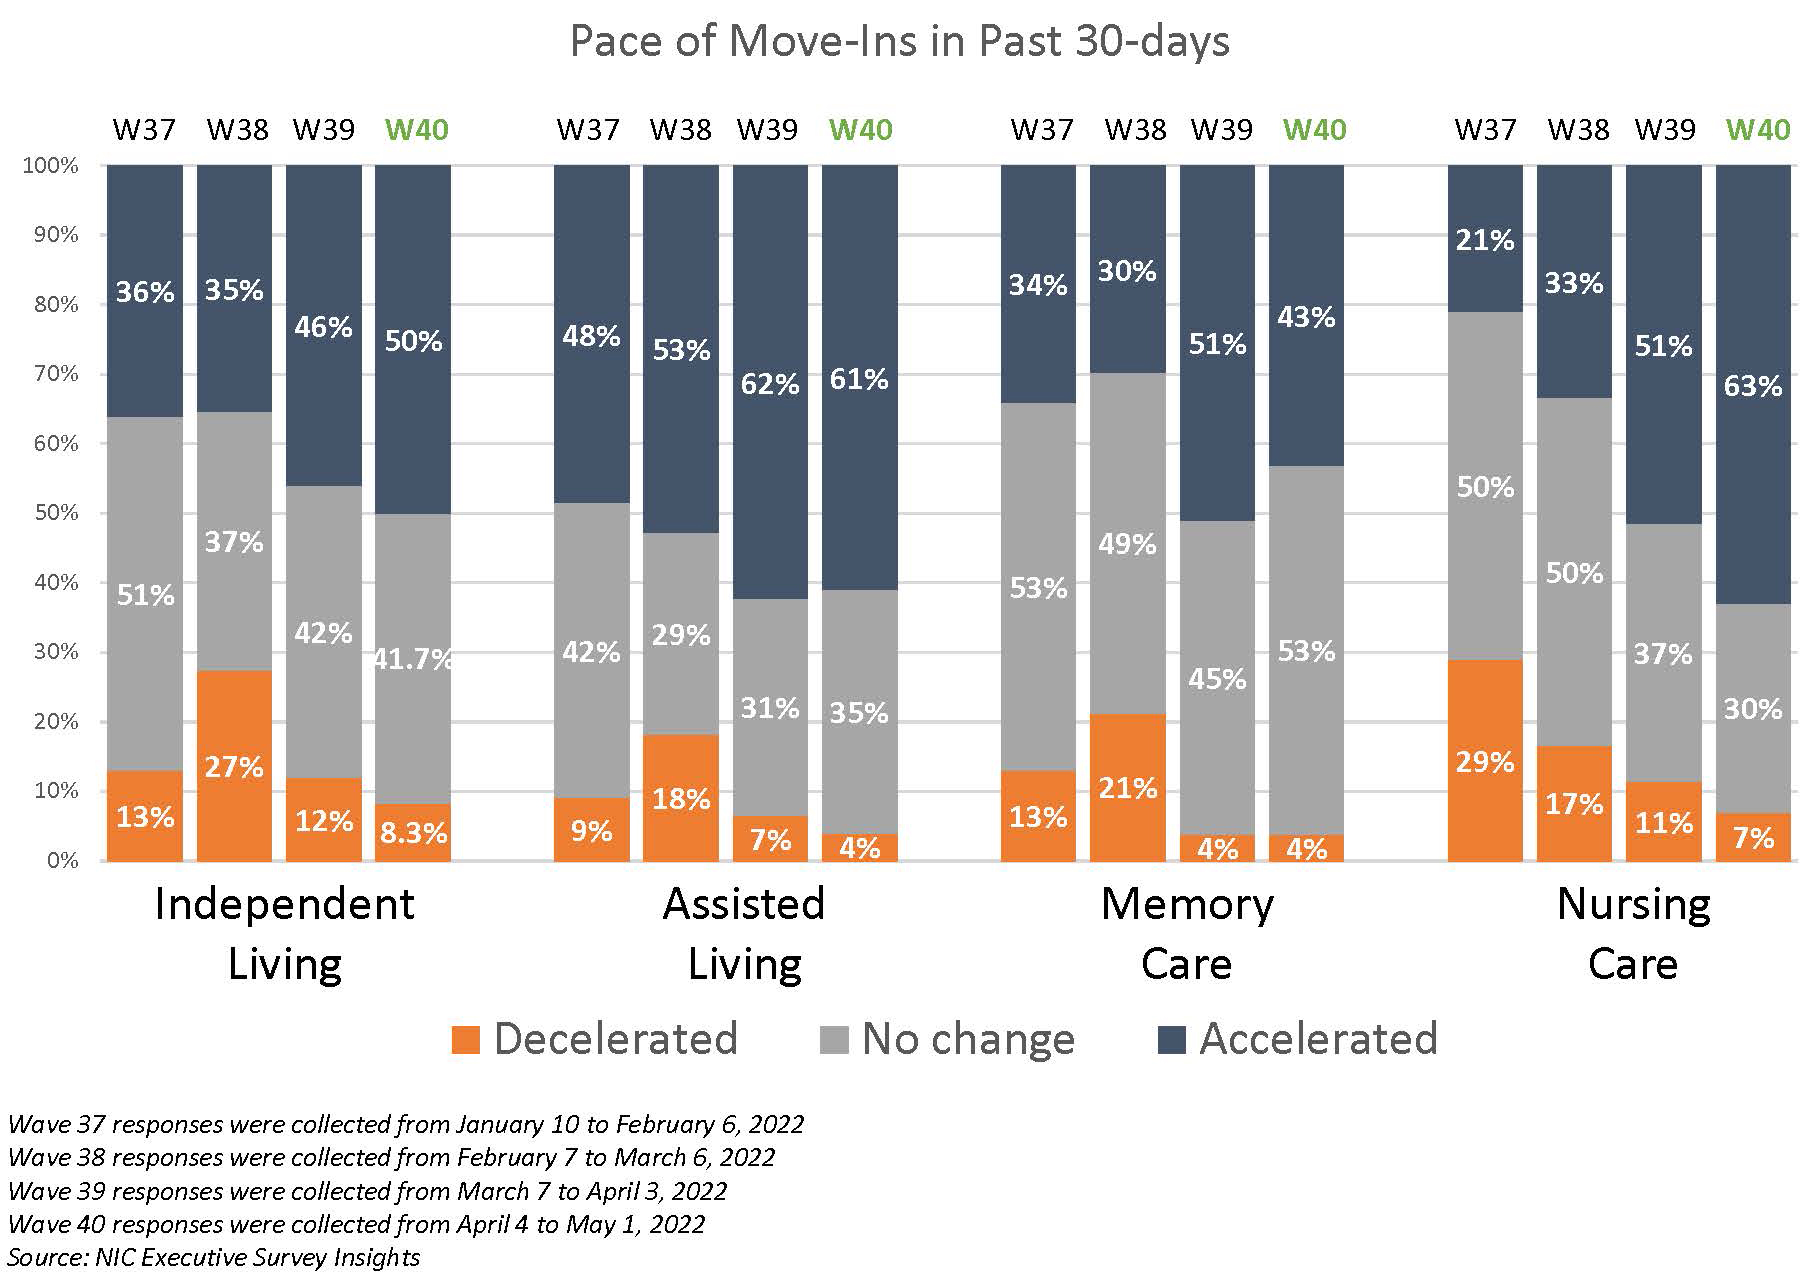
In the Wave 40 survey (reflecting operator experiences in April), between roughly 40% and 60% of organizations with independent living residences, assisted living residences, memory care residences, and nursing care beds reported an acceleration in the pace of move-ins. Since January, the shares of organizations that reported acceleration in nursing care move-ins increased significantly—from 21% in Wave 37 to 63% in Wave 40.
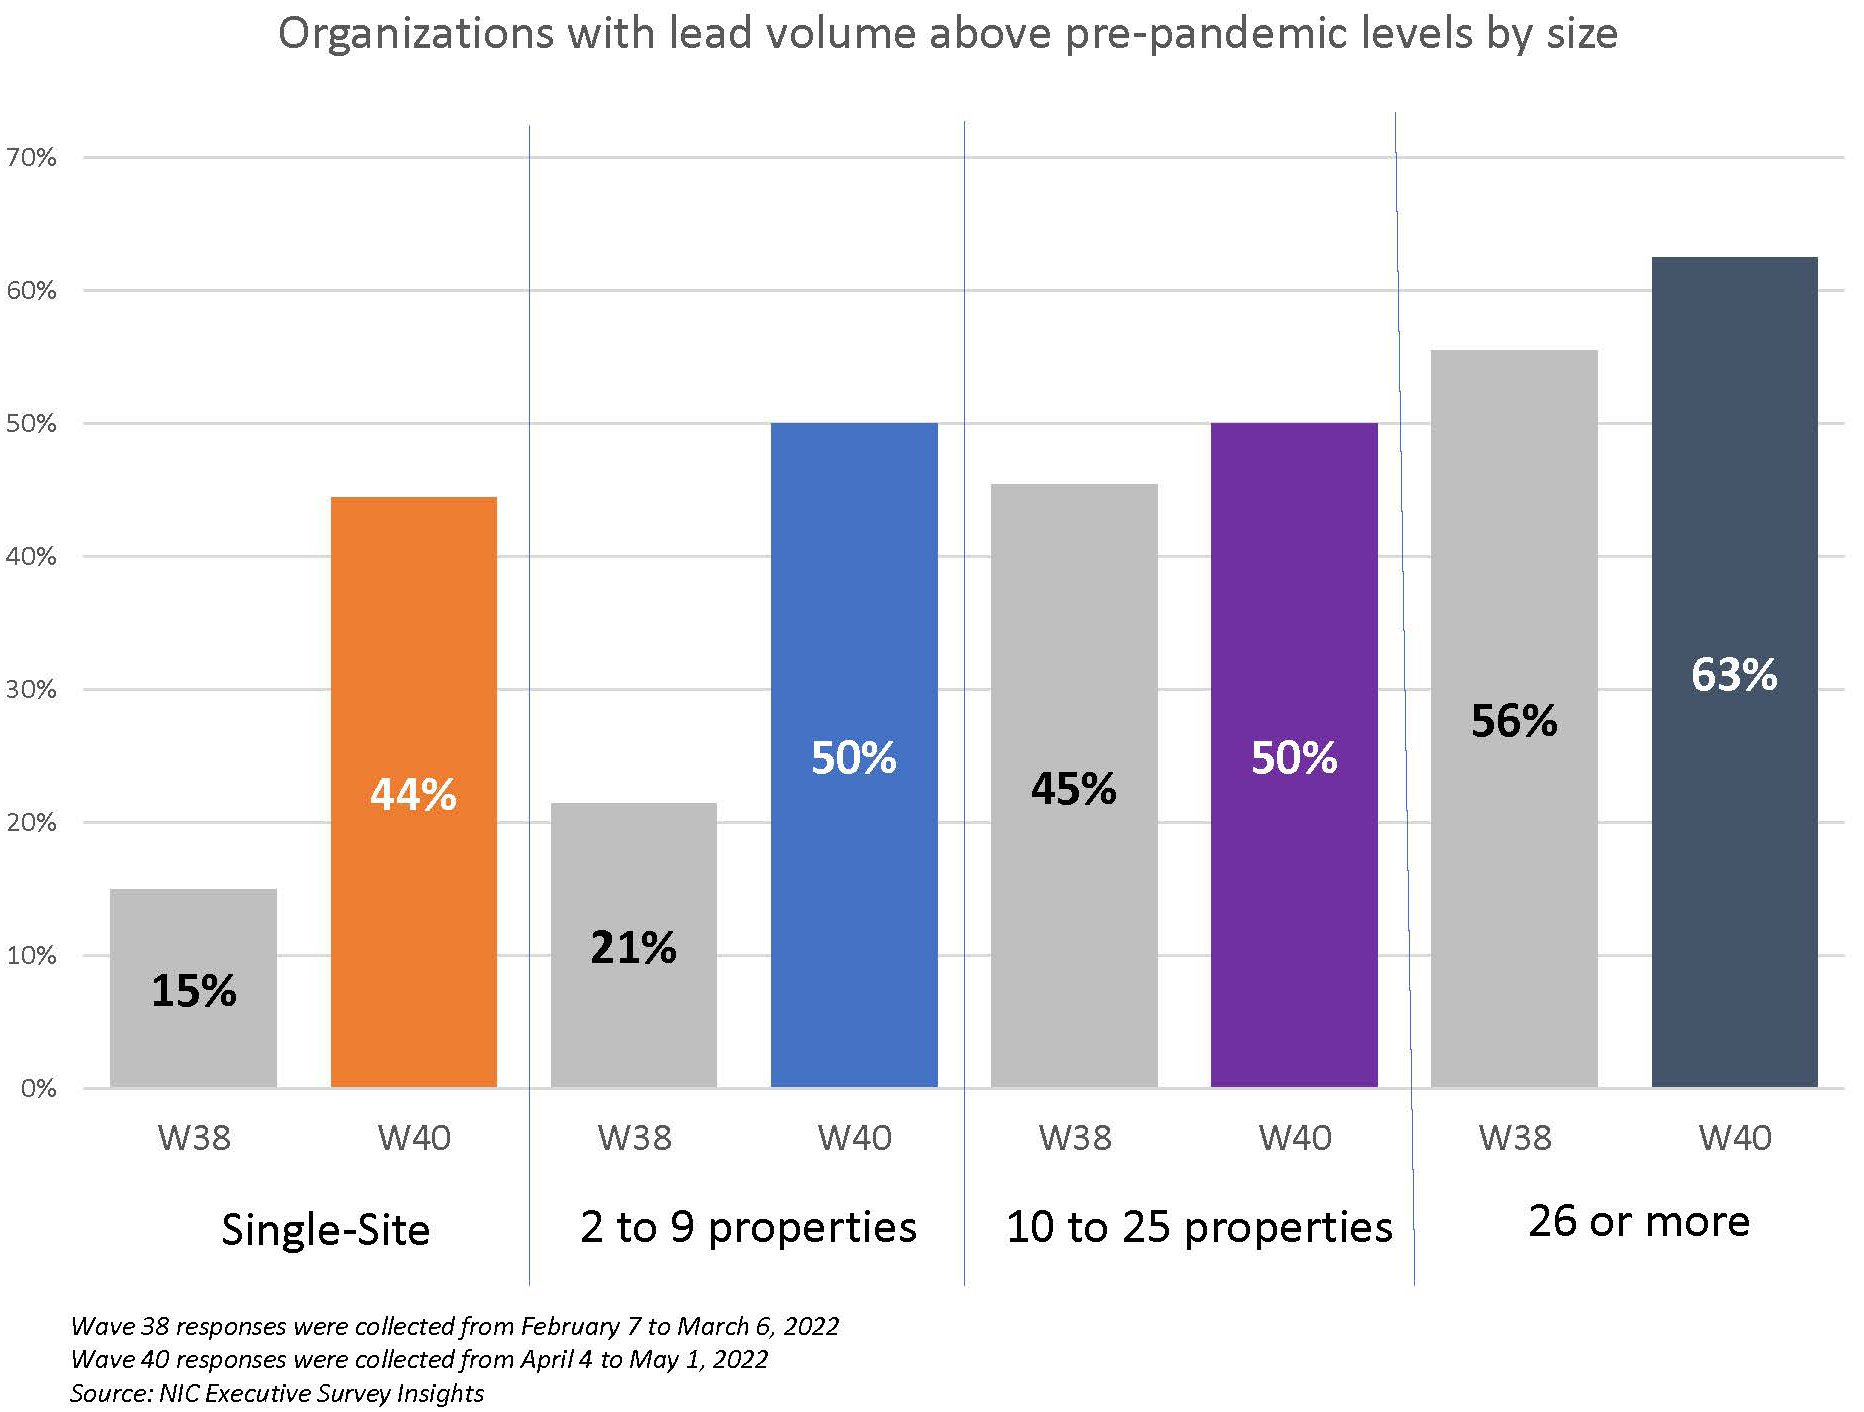
One-half of respondents to the Wave 40 survey (52%) reported lead volumes above pre-pandemic levels in April—a notable increase from the Wave 38 survey reflecting results in February (33%). Smaller organizations saw the most significant gains. Single-site operators with lead volume above pre-pandemic levels rose from 15% to 44% in Wave 40, and operators with 2 to 9 properties increased from 21% to 50%). Given pent-up demand coming out of the pandemic and questions about the sustainability of record-high absorption rates in the last half of 2021 per NIC MAP Vision data, this measure in the ESI may be a leading indicator to watch with regard to occupancy recovery.
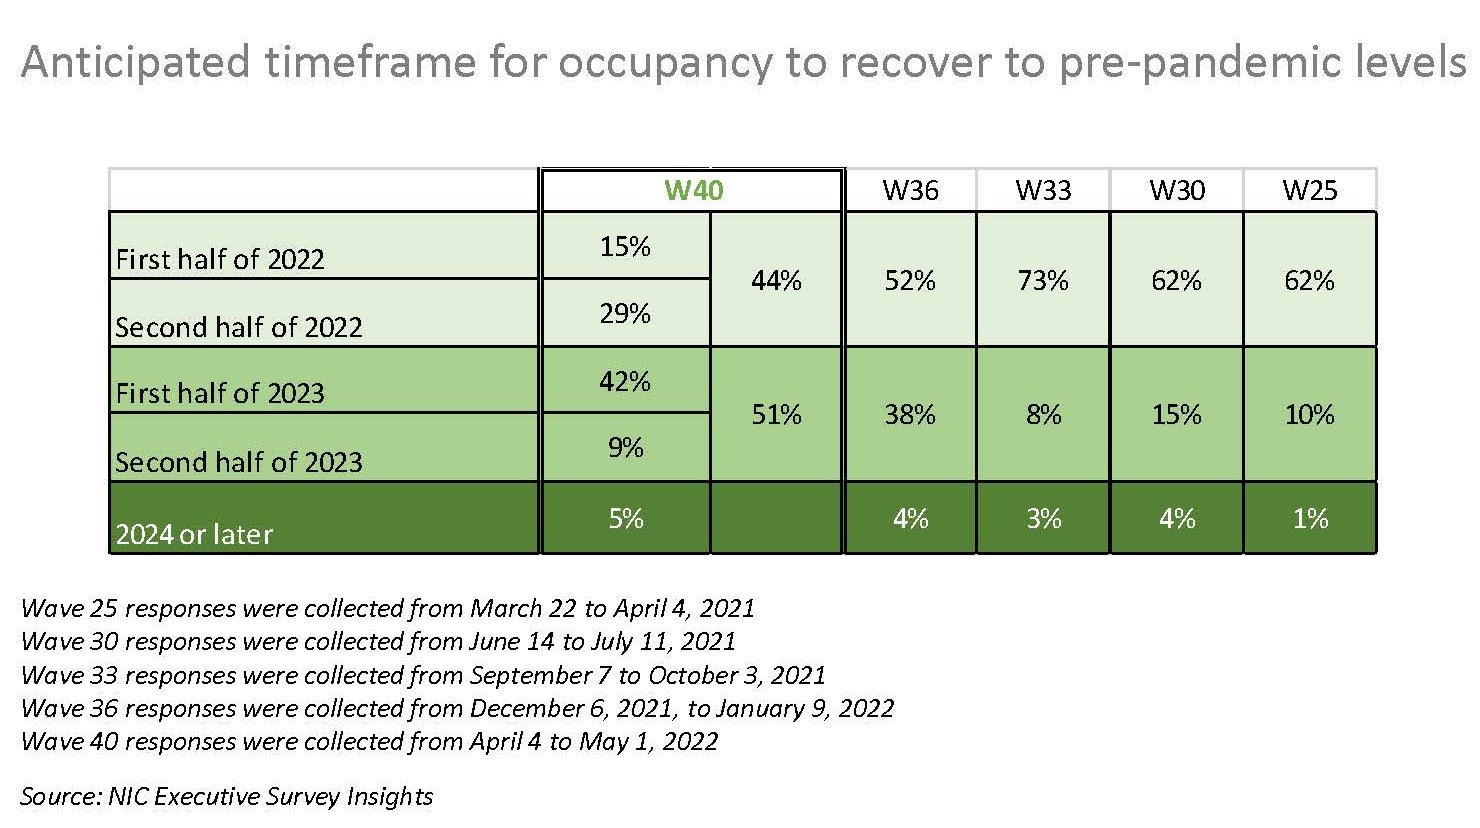
Expectations for occupancy to recover to pre-pandemic levels in the near term have tempered over the past year. One-half of organizations (51%) currently expect occupancy recovery to occur in 2023, with 42% expecting it to happen in the first half of 2023. In the Wave 33 survey conducted in the fall of 2021, three-quarters of respondents expected their occupancy to recover to pre-pandemic levels by the first half of 2022.
Wave 40 Survey Demographics
- Responses were collected between April 4 to May 1, 2022, from owners and executives of 65 seniors housing and skilled nursing operators across the nation. Owner/operators with 1 to 10 properties comprise roughly one-half (55%) of the sample. Operators with 11 to 25 and 26 properties or more make up the rest of the sample (20% and 25%, respectively).
- More than one-half of respondents are exclusively for-profit providers (58%), one-third operate not-for-profit seniors housing and care organizations (33%), and 9% operate both.
- Many respondents in the sample report operating combinations of property types. Across their entire portfolios of properties, 75% of the organizations operate seniors housing properties (IL, AL, MC), 22% operate nursing care properties, and 31% operate CCRCs (aka life plan communities).
Owners and C-suite executives of seniors housing and care properties, please help us tell an accurate story about our industry’s performance. If you are an owner or C-suite executive of senior housing and care and have not received an email invitation to take the survey, please contact Lana Peck at lpeck@nic.org to be added to the list of recipients.
NIC wishes to thank respondents for their valuable input and continuing support for this effort to provide the broader market with a sense of the evolving landscape as we recover from the pandemic. This is your survey! Please take the Wave 41 survey and suggest new questions for Wave 42.