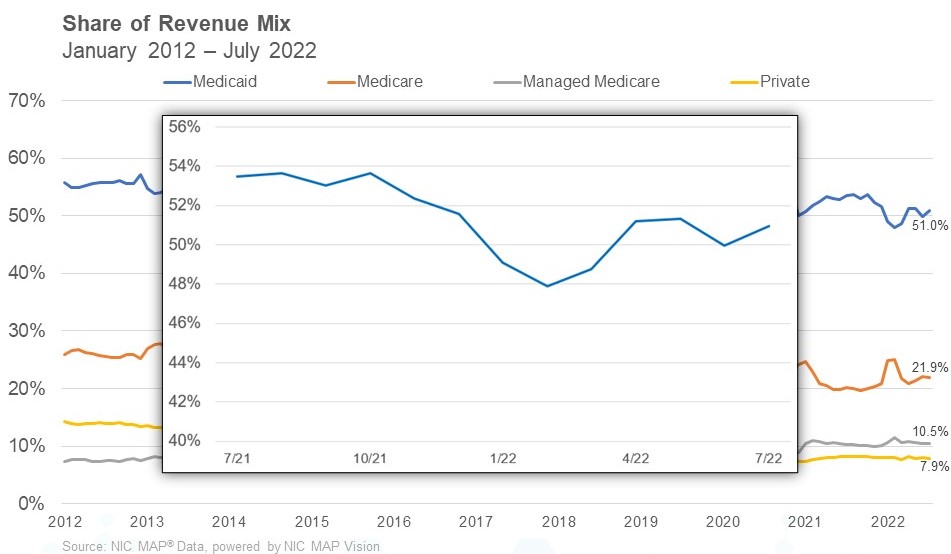
“In addition to managing occupancy and staffing challenges, skilled nursing operators need to be laser-focused on reimbursement at the state level as Medicaid represents 51% of revenue.”
– Bill Kauffman
NIC MAP Vision released its latest Skilled Nursing Monthly Report on September 29, 2022. The report includes key monthly data points from January 2012 through July 2022.
Here are some key takeaways from the report:
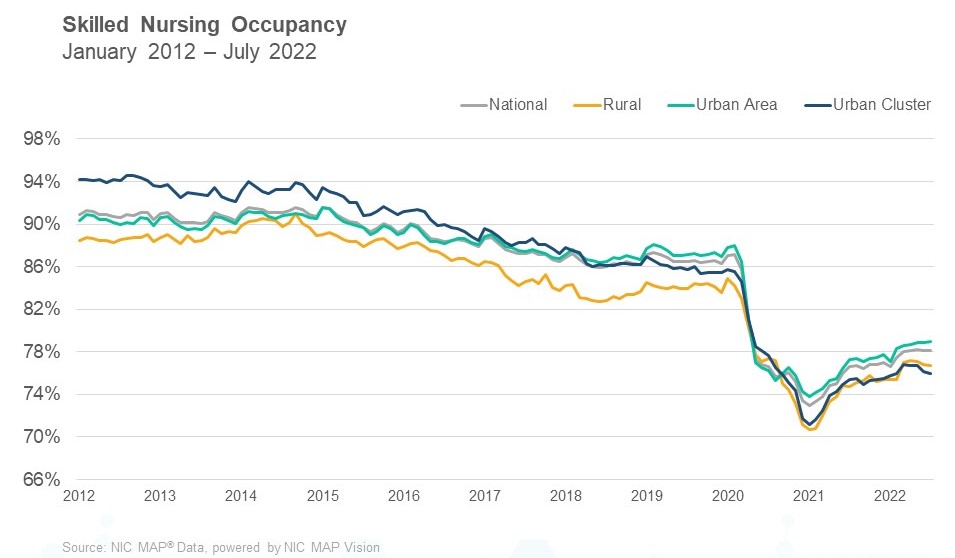
Skilled nursing property occupancy was relatively flat in July. It ended the month at 78.1%. In the last five months, skilled nursing occupancy has hovered in the range of 78% which is the highest occupancy level since April 2020, at which time occupancy began to fall rapidly due to the onset of the pandemic. Occupancy continues to recover since the pandemic low of 72.9% set in January 2021 but has encountered challenges such as new COVID-19 variants and staffing shortages. Staffing shortages continue to create difficulties within skilled nursing properties limiting the ability to admit new residents in some markets. However, the current occupancy trend does suggest that demand for skilled nursing properties is recovering, given the 148-basis point increase from January to July this year (2022). Occupancy has increased 151 basis points from one year ago and 517 basis points from its pandemic low.
Managed Medicare revenue per patient day (RPPD) continued its decrease in July. It decreased from $460 to $458 in July and is down 1.1% from last year in July 2021. It has decreased $112 (19.6%) from January 2012. The persistent decline in managed Medicare revenue per patient day continued to result in an expanded reimbursement differential between Medicare fee-for-service and managed Medicare, which accelerated during the pandemic until January 2022. The difference between Medicare fee-for-service and managed Medicare RPPD in January 2022 was $127. Pre-pandemic, in February of 2020, the differential was $95. However, the difference has decreased since January 2022 to end July 2022 at $115. Meanwhile, managed Medicare revenue mix was flat from June to July at 10.5%. It is up, however, 21 basis points from last year and has increased 244 basis points from the pandemic low of 8.1%. The increase from the pandemic low is likely due to growth in surgeries that require rehab, which typically creates additional referrals to skilled nursing properties.
Medicare revenue mix declined 25 basis points to end July at 21.9%. After increasing to start 2022, from December 2021 (20.7%) to January 2022 (24.8%), it has now decreased 308 basis points from the 2022 high (25.0%) set in February. The increase at the start of 2022 was likely due to the elevated number of COVID-19 cases in January and suggests there was a significant uptick in the utilization of the 3-Day Rule waiver as COVID-19 cases increased. The 3-Day Rule waiver was implemented by Centers for Medicare and Medicaid Services (CMS) to eliminate the need to transfer positive COVID-19 patients back to the hospital to qualify for a Medicare paid skilled nursing stay, hence increasing the Medicare census at properties. As cases declined, the Medicare revenue share has declined as well. Meanwhile, Medicare revenue per patient day (RPPD) decreased to the lowest level of 2022 to end July at $574, which is down 2.6% from January. One possible explanation is there has been lower reimbursement due to relatively fewer COVID-19 cases compared to January 2022. Additional reimbursement is needed for COVID-19 positive residents, which requires additional measures of care to be implemented.
Medicaid revenue mix increased 99 basis points from June to end July at 51.0%. It has increased 307 basis points since February. Some of this increase is related to what was mentioned above, regarding the decline in COVID-19 cases since the winter months and patients have now moved from Medicare patient days back to Medicaid, after utilizing the 3-Day Rule waiver. Meanwhile, Medicaid revenue per patient day (RPPD) increased from June to end July 2022 at $258. It is up 4.9% from the pre-pandemic period (February 2020) as many states embraced measures to increase reimbursement related to the number of COVID-19 cases to support skilled nursing properties, in addition to fiscal year increases.
To get more trends from the latest data you can download the Skilled Nursing Monthly Report. There is no charge for this report.
The report provides aggregate data at the national level from a sampling of skilled nursing operators with multiple properties in the United States. NIC continues to grow its database of participating operators to provide data at localized levels in the future. Operators who are interested in participating can complete this participation form. NIC maintains strict confidentiality of all data it receives.


 NIC COO Chuck Harry recently talked with two executives at Paychex about how senior living providers can address staffing challenges based on an understanding of what today’s workers want and expect. Here is a recap of his conversation with Paychex’s Kate Risa, strategic accounts consultant, and Brittany Riese, HR business partner.