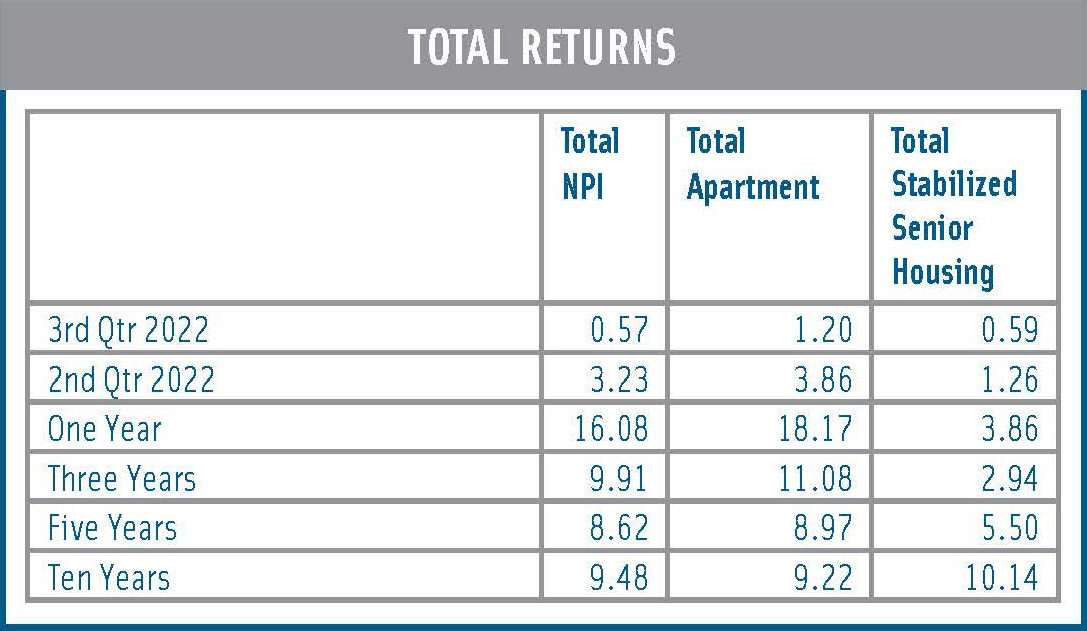
The total investment return for the senior housing sector was a positive 0.59% in the third quarter of 2022. This marked the ninth consecutive quarterly gain after one quarter of pandemic-related negative returns in the second quarter of 2020 (negative 1.00%). Short-term total returns for senior housing are on par with the broader NPI, which posted a total return of 0.57% in the third quarter. Positive income returns for both the NPI and senior housing were partially offset by negative appreciation, reducing the overall investment return.
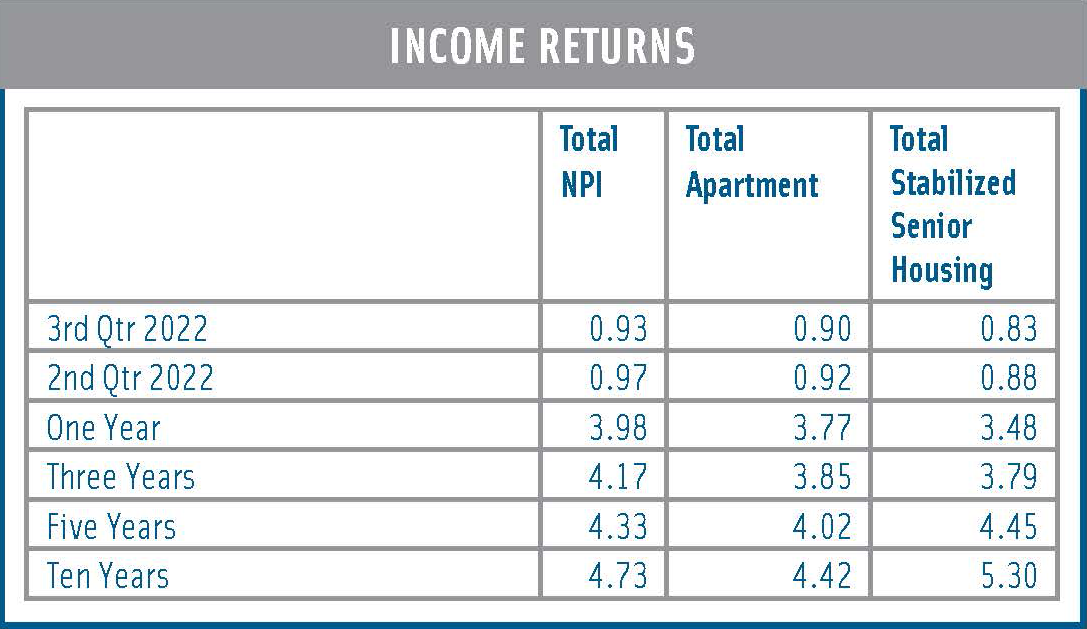
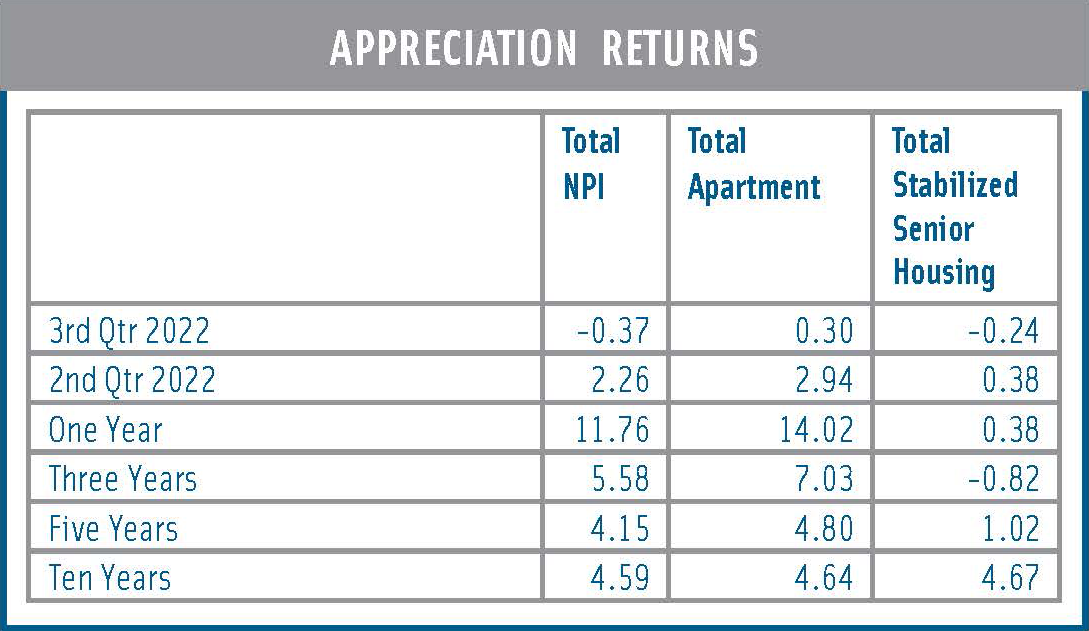
The senior housing income return in the first quarter was 0.83%, stronger than industrial (0.76%), but below the overall NPI (0.93%). The appreciation (capital/valuation) return was -0.24% and followed four consecutive quarterly gains. Current economic and capital market returns have hurt appreciation returns, especially for retail (-0.80%) and office (-1.70%). Further, many investors have reduced their appreciation expectations for senior housing as the impact of the coronavirus has weighed heavily on their view of the sector. The appreciation return is the change in value net of any capital expenditures incurred during the quarter.
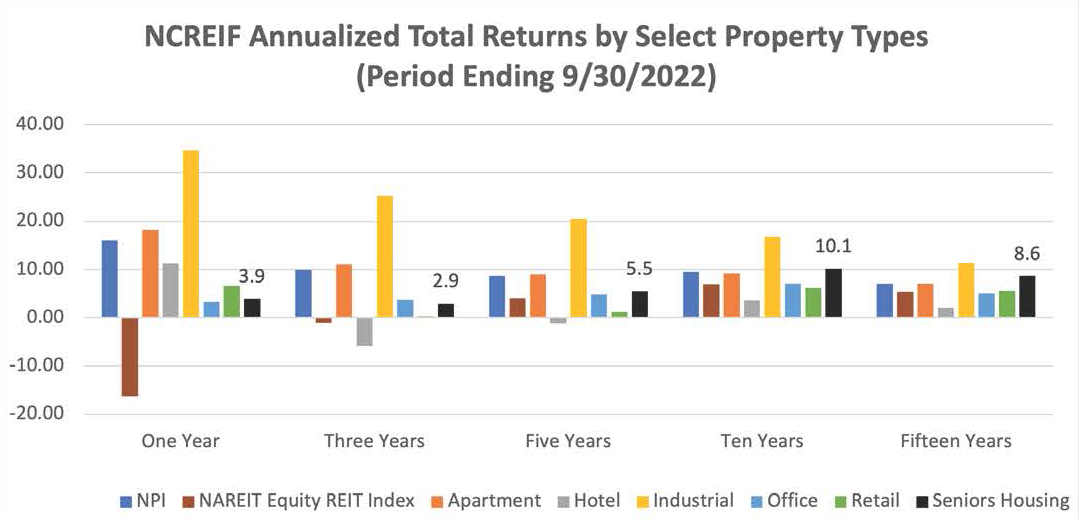
On a longer-term basis, the ten-year return for senior housing was the strongest of the main property types, except for industrial. For this time frame, total returns equaled 10.14%. This compares to 9.48% for the NPI. Income returns for senior housing (5.30%) surpassed the NPI (4.73%), as did the appreciation return (4.67%).
Note that the performance measurements cited above for senior housing reflect the returns of 189 senior housing properties valued at $10.62 billion in the third quarter. This was the highest property count and market value in the NCREIF time series for senior housing. It’s also notable that the number of properties tracked by this index has grown significantly since the beginning of the pandemic, having been 134 properties in the first quarter of 2020, valued at $6.3 billion. The additional properties may be influencing the overall performance returns of the index.
Third quarter 2022 market fundamentals data for senior housing showed improved demand patterns and moderate growth in inventory in the 31 Primary Markets, according to NIC MAP® data powered by NIC MAP Vision. The occupancy rate for senior housing stood at 82.2% in the third quarter, up one full percentage point from the second quarter and 4.3 percentage points from its low point, but still 5.0 percentage points below its pre-pandemic level of 87.2% in the first quarter of 2020. The average masks the wide range of occupancy rates by property, however, with 35% of properties having occupancy levels at or above 90%. While these statistics are promising, future occupancy improvement will be shaped by local patterns of inventory growth and demand, and will be influenced by the broad economy, consumer confidence, inflation pressures, rising interest rates, the ease of development, COVID- 19 variants, and vaccination rates.
Source: Third Quarter 2022 NCREIF Performance Report, NIC Analytics