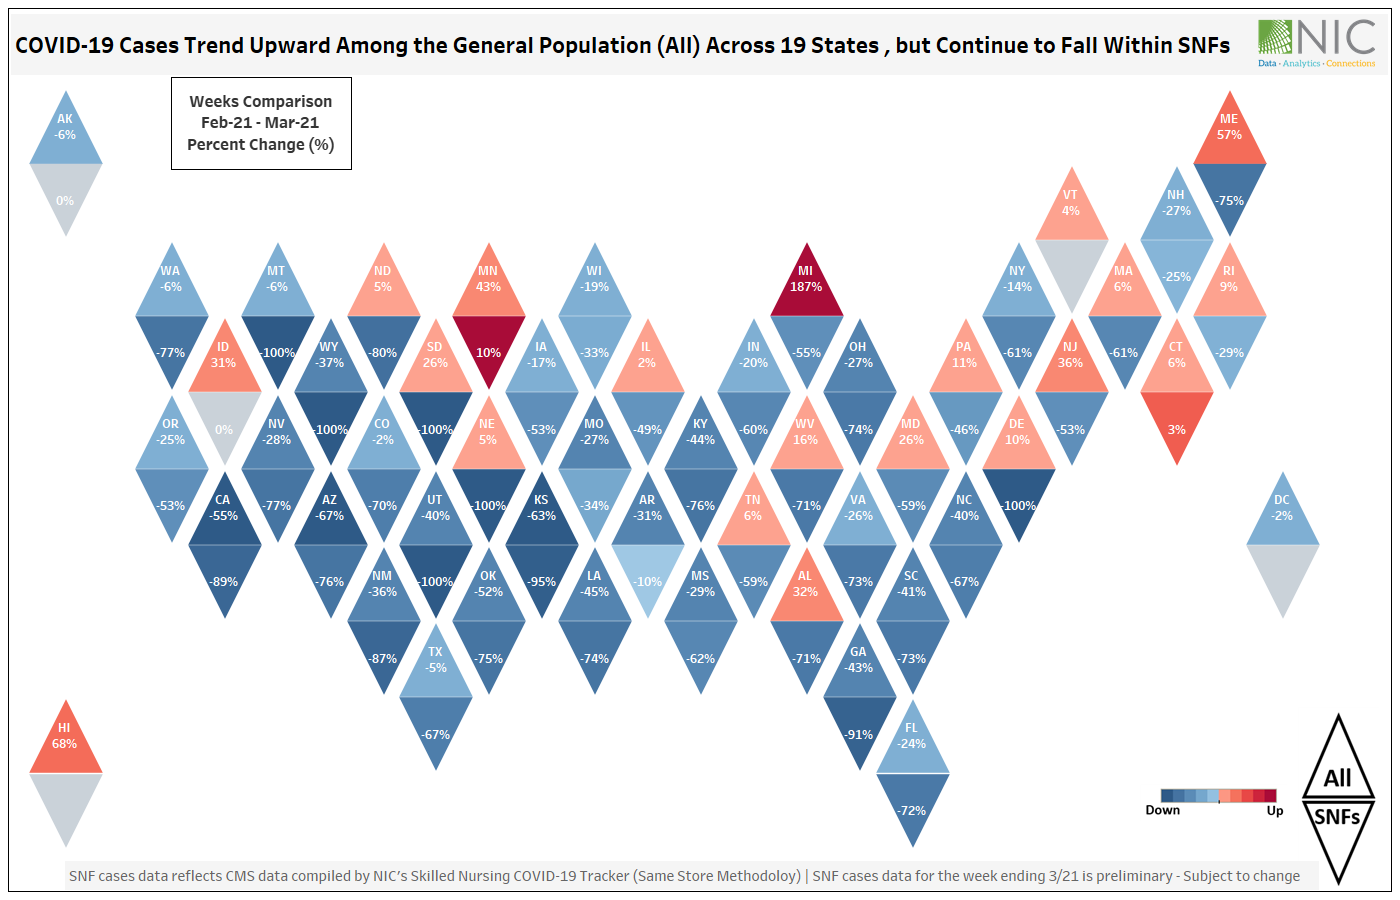
As the U.S. enters the fourth week of rising COVID-19 cases, nineteen states have reported increasing COVID-19 cases among the general population for the week ending March 21. According to the CDC, Michigan reported the highest increase in COVID-19 cases among the general population at 187%, up from 7,313 cases during the week ending Feb 21 to 20,982 on March 21. Interesting and in contrast, skilled nursing facilities in Michigan reported a 55% decline in newly confirmed cases among residents over the same week-over-week period.
Other states that saw significant increases in cases between the reporting weeks of February 21 and March 21 are Maine (57%), New Jersey (36%), Alabama (32%), Idaho (31%), Maryland (26%), while at the same time, all of these states reported falling COVID-19 cases within their skilled nursing facilities. This may suggest that at this point in this 13-month pandemic, older Americans may indeed be safer in skilled nursing properties than in the general population.

CMS data as of March 21 compiled by NIC’s Skilled Nursing COVID-19 Tracker show that six states reported no new COVID-19 cases within their skilled nursing facilities for the week ending March 21 – down 100% from February 21 levels. These states include Wyoming, Montana, South Dakota, Nebraska, Utah, and Delaware.
Furthermore, more than twenty states reported fewer than 10 newly confirmed cases among residents across all their skilled nursing facilities. However, two states (Minnesota and Connecticut) reported a very small uptick in newly confirmed cases among skilled nursing residents, but the increases remain relatively low. (See interactive tool below for more details).

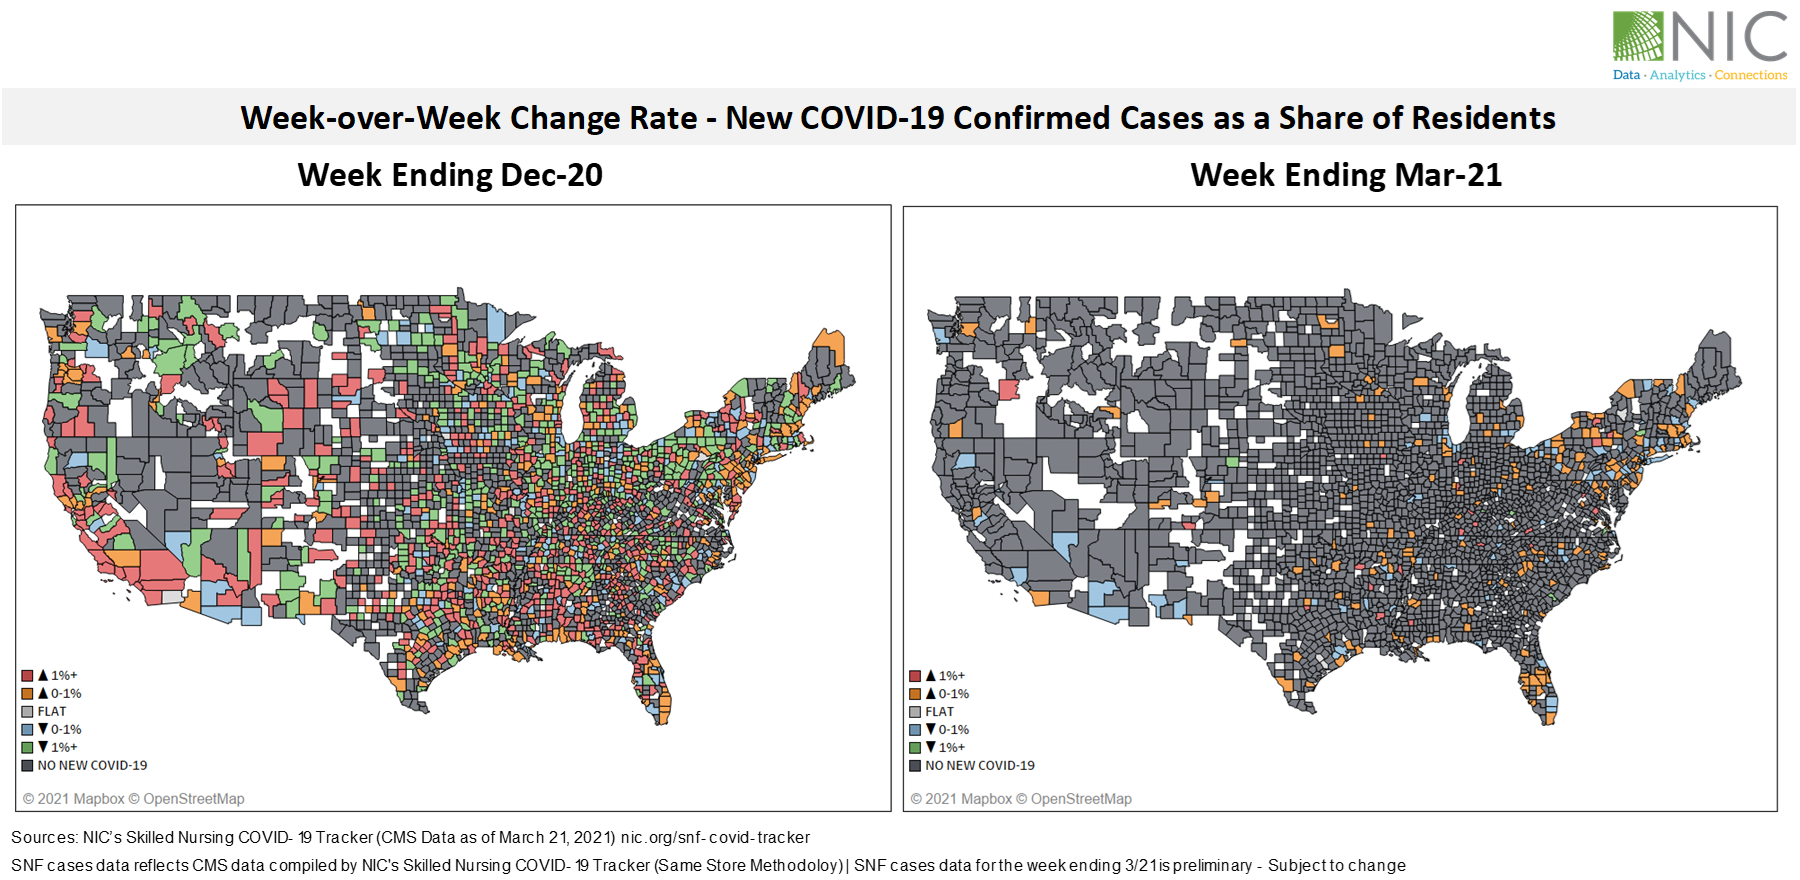
NIC’s Skilled Nursing COVID-19 Tracker shows that more counties are “turning grey” on the Tracker map, i.e., they report no new COVID-19 cases for the week ending March 21 compared to three months earlier on December 20 and prior to vaccine rollout. The difference between the two maps above corroborates the success story of the long-term care vaccination program for skilled nursing facilities and the effectiveness of the vaccines against new variants. The level of concern across skilled nursing facilities is most likely lower now than three months ago. This can only suggest a positive near-term outlook and more confidence in the post-pandemic picture and the safety of skilled nursing properties.
NIC’s new analysis below shows that new cases of COVID-19 in skilled nursing facilities account for just a fifth of 1% of U.S. cases overall on March 21, down from over 5% of cases in June 2020 and from over 2% in December 2020 and the launch of the long-term care vaccination program.
Per-resident rate of new COVID-19 infections continued to decline and reached a new pandemic low of 0.08% —only 8 in 10,000 residents of skilled nursing facilities tested positive for COVID for the week ending March 21, 2021 compared to 303 in 10,000 twelve weeks ago on December 20, 2020.
New Jersey weekly cases continue to accelerate since February 21, while weekly cases within skilled nursing facilities in New Jersey continued to decelerate and remained low. In fact, case counts within SNFs in New Jersey are down 92% from December 20 and 53% from February 21 through March 21 while weekly cases among the general population there are down 23% from December 20 but up 30% from February 21 levels. Choose specific regions or states from the dropdowns in the tool below to change the graphs.
NIC’s new interactive tool tracks the incidence of COVID-19 and provides a way to compare weekly infections of COVID-19 in skilled nursing facilities and in the U.S. and across regions, sub regions, and states. Data show
- weekly confirmed cases in SNFs vs. U.S. (sort by region, sub region, or state)
- per-resident rate of new COVID-19 infections within SNFs (all vs. specific region/state)
- weekly confirmed cases among skilled nursing residents as a share of U.S. weekly cases.
- Summary states table (choose any two weeks comparison to compute the percent change).
The data is displayed in an easy-to-use interactive dashboard that allows sorts down to state level, with data updated weekly. Check back each week to see and compare current data.