Record Decline of 20.5 million Jobs in April, As Stay at Home Orders Cause Massive Job Losses

Initial Jobless Claims Lower, but Still Nose-bleedingly High

The Labor Department reported that there were a nose-bleedingly high 20.5 million jobs lost in April as the COVID-19 pandemic closed much of the economy and triggered massive layoffs and furloughs of employees by U.S. businesses. This dwarfed the previous record high job loss of 1.96 million jobs in 1945 at the end of WWII and the 8.7 million jobs lost during the entire last recession. Employment is now at its lowest level since February 2011. April’s decline also marked the second monthly decline in jobs after a record 113 consecutive months of job gains.  


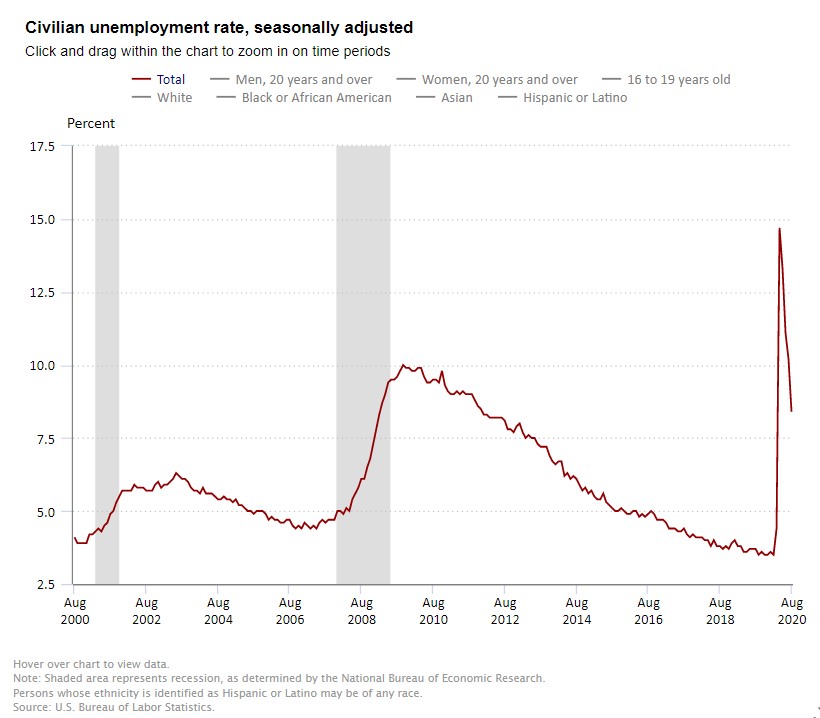
Separately, the April unemployment rate surged to 14.7%, up from 4.4% in March and from a 50-year low of 3.5% in February. This is the highest jobless level since the Great Depression according to the Labor Department figures that date back to the 1940s and the National Bureau of Economic Research data prior to that. During the 2008/2009 recession, the unemployment rate peaked at 10%.

The underemployment rate or the U-6 jobless rate soared to 22.7% in April from 8.7%. This figure includes those who have quit looking for a job because they are discouraged about their prospects and people working part-time but desiring a full work week. In the previous 2008/2009 recession, this rate peaked at 17.2%.

Employment fell sharply in all major industry sectors, with particularly heavy job losses in leisure and hospitality. Employment in health care fell by 1.4 million in April. The decline in healthcare reflects those not working to fight the pandemic because they are seeing fewer patients for routine checkups and, in some cases, only offering emergency procedures.

Revisions also subtracted thousands of jobs in the prior two months. The change in total nonfarm payroll employment for February was revised down by 45,000 from a gain of 275,000 to a gain of 230,000 and the change for March was revised down by 169,000 from a loss of 701,000 to a loss of 870,000. Combined, 214,000 jobs were subtracted to the original estimates. Monthly revisions result from additional reports received from businesses and government agencies since the last published estimates and from the recalculation of seasonal factors.

Average hourly earnings for all employees on private nonfarm payrolls rose in April by $1.34 to $30.01, a 7.9% increase from year-earlier levels. The increases in average hourly earnings largely reflect the substantial job losses among lower-paid workers, which put upward pressure on the average hourly earnings estimate.

The labor force participation rate, which is a measure of the share of working age people who are employed or looking for work fell 2.5 percentage point to 60.2%. Total employment, as measured by the household survey fell by 22.4 million to 133.4 million.

Separately yesterday, the Department of Labor reported that 3.2 million Americans filed for unemployment insurance benefits in the week ending May 2, 2020. In the past seven weeks, 33 million people have filed claims.

Today’s report was not unexpected as the pandemic has dramatically halted economic activity across the nation and globe. The question becomes how long the devastation will continue, which in turn largely depends on COVID-19 related factors such as when a vaccine become available, testing of the general population and when business are able to reopen. Even then while some businesses may gradually return to “normal”, not every sector will recover at the same pace. In the meanwhile, and tragically, millions of people are suffering from illnesses, anxieties and deaths associated with the pandemic and from the human tragedies associated with of the collapse in the national and global economies.

Executive Survey Insights  | Wave 5, Week Ending May 3, 2020

A NIC report developed to provide timely insights from owners and C-suite operators on the pulse of seniors housing and skilled nursing sectors. Wave 5.

A NIC report developed to provide timely insights from owners and C-suite operators on the pulse of seniors housing and skilled nursing sectors.

NIC’s weekly Executive Survey of operators in seniors housing and skilled nursing is designed to deliver transparency into market fundamentals in the seniors housing and care space at a time where market conditions are rapidly changing—providing both capital providers and capital seekers with data as to how COVID-19 is impacting the space, helping leaders make informed decisions.

This week’s sample (Wave 5) includes responses collected April 27-May 3, 2020 from owners and executives of 118 seniors housing and skilled nursing operators from across the nation. Detailed reports for each “wave” of the survey can be found on the NIC COVID-19 Resource Center webpage under Executive Survey Insights.

Summary of Insights and Findings

The majority of organizations—across their portfolios of properties—continue to report decelerations in move-ins in Wave 5. However, while fewer organizations with independent living and assisted living units reported occupancy rate declines from a month ago in Wave 5 of the survey compared to Wave 4, downward changes in occupancy rates in the memory care segment continue to grow. For the nursing care segment, the share of occupancy declines from a month ago was slightly lower in Wave 5 than in Waves 4 and 3, although still up around 80%.

  • Around 70% of organizations report that the pace of move-ins decelerated in the past 30-days for their independent living, assisted living and memory care segments in Wave 5 of the survey. Only about one-quarter indicated no change in the pace of move-ins for these care segments. While most organizations reporting on their nursing care segments in Wave 5 of the survey note a deceleration in move-ins (84%), the share is slightly higher than in Wave 4 (76%) but similar to Wave 3 (87%).
  • The most common reason cited for deceleration in move-ins continues to be slowdowns in leads conversions/sales due to moratoriums of moving residents into communities to mitigate COVID-19 contagion among residents and the staff members who care for them. However, more respondents in Waves 5 and 4 of the survey cited an organization-imposed ban on settling new residents into their communities than in Waves 3 and 2 of the survey.
  • More organizations with any nursing care beds responding to Wave 5 and Wave 4 of the survey report an organization-imposed ban on accepting new residents than organizations without any nursing care beds. Additionally, a smaller but growing percentage of organizations with any nursing care beds, also cite a mandatory government-imposed ban on admitting new residents (17% in Wave 2 up to 32% in Wave 5).
  • The majority of respondents continue to report no change in the pace of move-outs in the past 30-days in Wave 5 of the survey. The pace of move-outs reported for the nursing care segment has been consistent since Wave 2 of the survey with around one-third of organizations noting an acceleration in move-outs. However, the assisted living and memory care segments continue to see an increasing share of acceleration in move-outs.
  • Among the primary reasons given for acceleration in move-outs is resident mortality. Secondary reasons cited by respondents were resident or family member concerns, residents moving to higher levels of care, hospitalizations, and planned discharges.
  • In Wave 5 of the survey, approximately one-half to more than two-thirds of organizations reporting on their independent living, assisted living and memory care segments experienced a decrease in occupancy from the prior month. However, more organizations with independent living units in Wave 5 than the prior two waves saw no change in their occupancy. Organizations with memory care units report more downward changes in occupancy than in the prior three waves of the survey. The proportion of organizations reporting nursing care segment occupancy declines in Wave 5 was down slightly from Wave 3 to Wave 5.
  • Roughly two-thirds to one-half of organizations with independent living, assisted living and memory care segment units noted no change in occupancy rates from one week ago in Wave 5 of the survey. However, fewer organizations with assisted living units reported occupancy declines from a week ago compared to Waves 4 and 3. About two-thirds of the organizations reporting on their nursing care segments in Wave 5 note declines from one week ago, slightly higher compared to Wave 4 and Wave 2 of the survey, but consistent with Wave 3.

Wave 5 Survey Demographics

  • Responses were collected April 27-May 3, 2020 from owners and executives of 118 seniors housing and skilled nursing operators from across the nation.
  • Nearly two-thirds of respondents were exclusively for-profit providers (62%), about one-third (32%) were exclusively nonprofit providers, and 6% operate both for-profit and nonprofit seniors housing and care organizations.
  • Owner/operators with 1 to 10 properties comprise 55% of the sample. Operators with 11 to 25 properties make up 23% while operators with 26 properties or more make up 21% of the sample.
  • Many respondents in the sample report operating combinations of property types. Across their entire portfolios of properties, 79% of the organizations operate seniors housing properties (IL, AL, MC), 35% operate nursing care properties, and 30% operate CCRCs (aka Life Plan Communities).

Key Survey Results

Pace of Move-Ins and Move-Outs

Respondents were asked: “Considering my organization’s entire portfolio of properties, overall, the pace of move-ins and move-outs by care segment in the past 30-days has…”

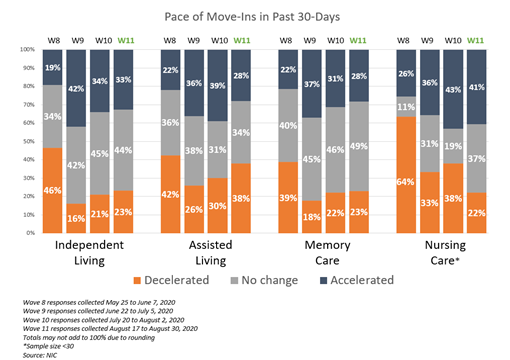
  • In Wave 5 of the survey, between 71% and 74% of organizations reporting on their independent living, assisted living and memory care segments indicated that the pace of move-ins decelerated. However, between 24% and 28% report no change in the pace of move-ins for these care segments.
  • Most of the organizations reporting on their nursing care segments in Wave 5 of the survey note a deceleration in move-ins (84%); the share is higher compared to Wave 4 (76%) and slightly lower than Wave 3 (87%).

Reasons for Deceleration in Move-Ins

Respondents were asked: “The deceleration in move-ins is due to…”

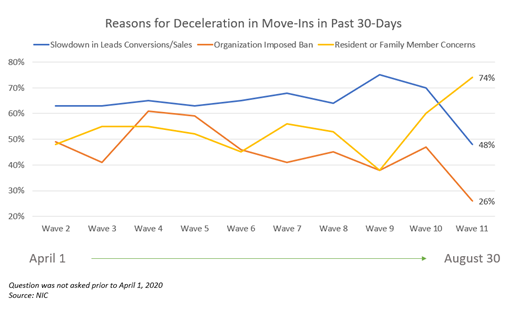
  • In Wave 5 of the survey, roughly two-thirds of respondents attributed the deceleration in move-ins to a slowdown in leads conversions/sales. More respondents in Waves 5 and 4 cited an organization-imposed ban on settling new residents into their communities compared to Waves 3 and 2 (59% and 61% vs. 41% and 49%, respectively). Around one-half of organizations across each of the four data collection periods cited resident or family member concerns.
  • The following charts break out the reasons for deceleration in move-ins by organizations with any nursing care beds and organizations without any nursing care beds.

NIC Executive Survey Insights,Wave 5, Move-Ins

NIC Executive Survey Insights Wave 5 Move-Ins with Nursing Care

  • In Waves 5 and 4 of the survey, more organizations responding with any nursing care beds reported an organization-imposed ban on accepting new residents compared to organizations without any nursing care beds. In both subsamples, the percentages have grown since Waves 2 and 3 of the survey, albeit at notably higher rates for organizations with any nursing care beds.
  • A growing percentage of organizations with any nursing care beds also cite a mandatory government-imposed ban on admitting new residents (17% in Wave 2 up to 32% in Wave 5).

Move-Outs

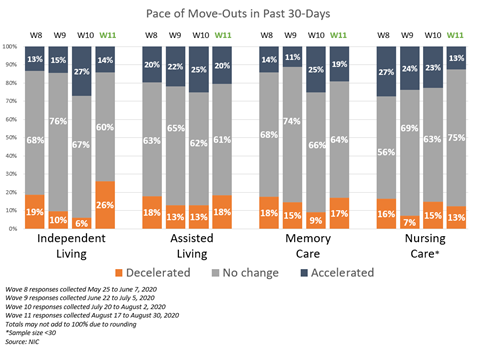
  • Between 60% and 71% of organizations reporting on their independent living, assisted living and memory care units saw no change in move-outs in the past 30-days, down slightly from Wave 4 (64% to 76%).
  • The assisted living and memory care segments continue to see increasing shares of an acceleration in move-outs across the four waves of the survey shown—from 13% in Wave 2 to 28% in Wave 5 for assisted living and from 8% in Wave 2 to 25% in Wave 5 for memory care.
  • The pace of move-outs reported for the nursing care segment has been consistent across waves of the survey with around one-third of organizations with nursing care beds noting an acceleration in move-outs.
    NIC Executive Survey Insights Wave 5 Pace of Move-Outs

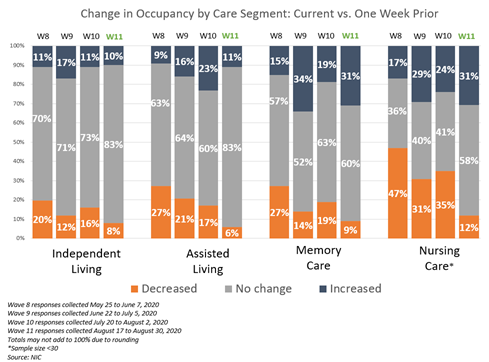
Change in Occupancy by Care Segment

Respondents were asked: “Considering the entire portfolio of properties, overall, my organization’s occupancy rates by care segment are… (Most Recent Occupancy, Occupancy One Month Ago, Occupancy One Week Ago, Percent 0-100)”

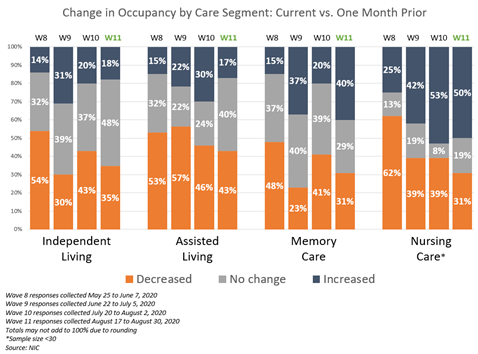
  • Approximately one-half to more than two-thirds (54% to 70%) of organizations reporting on their independent living, assisted living and memory care units in Wave 5 of the survey—across their respective portfolios of properties—experienced a decrease in occupancy from the prior month.
  • More organizations with independent living units in Wave 5 of the survey than in Wave 4 note no change in their occupancy rates compared to one month prior.
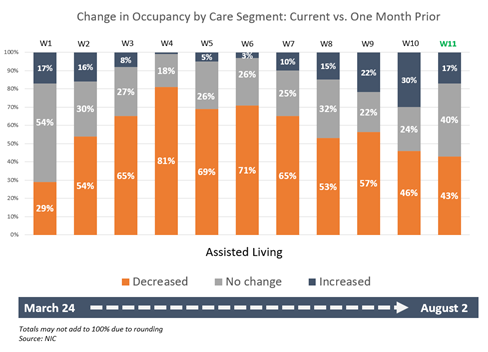
  • Despite more organizations with assisted living units reporting an acceleration in move-outs over the past 30-days in Wave 5 of the survey, the assisted living segment had fewer organizations reporting downward changes in occupancy rates than in Wave 4.
  • In Wave 5 of the survey, organizations with memory care units report a higher share of occupancy rates trending downward (70%) than in the prior three waves of the survey. The percent of organizations reporting nursing care segment occupancy declines in Wave 5 was down slightly from 84% in Wave 3 to 79% in Wave 5.

  • Regarding the change in occupancy from one week ago, roughly two-thirds to one-half of organizations with independent living, assisted living and memory care segment units noted no change (between 63% and 55%); however, fewer organizations with assisted living units reported occupancy declines from one week ago compared to waves 4 and 3 of the survey.
  • About two-thirds of the organizations reporting on their nursing care segments in Wave 5 of the survey note occupancy rate declines from one week prior (67%), slightly higher than Waves 4 and 2 (62%), but consistent with Wave 3 (67%).

This weekly survey is designed for operators to capture high level metrics with minimal time lag to market on important trends for operators and investors. While survey questions will evolve over time, primary key metrics will continue to include changes in occupancy, move-ins, and move-outs as well as COVID-19 related data. 

NIC wishes to thank survey respondents for their valuable input and continuing support for this effort to bring clarity and transparency into market fundamentals in the seniors housing and care space at a time where trends are rapidly changing. Your support helps provide both capital providers and capital seekers with data as to how COVID-19 is impacting the space, helping leaders make informed decisions. 

If you are an owner or C-suite executive of seniors housing and care properties and have not received an email invitation but would like to participate in the current Executive Survey, please click here for the current online questionnaire.

Headlines Digest: A New Normal is Forming

Today’s news, dominated every day by the COVID-19 pandemic, is often centered on the impact of this virus on seniors living in skilled nursing and seniors housing communities. While an ocean of print is lapping at every front page in the world, regulators and policy makers have rushed to enact new measures to protect frail […]

Today’s news, dominated every day by the COVID-19 pandemic, is often centered on the impact of this virus on seniors living in skilled nursing and seniors housing communities. While an ocean of print is lapping at every front page in the world, regulators and policy makers have rushed to enact new measures to protect frail elders, who are most susceptible to this disease. The resulting disruption that is occurring, and which we see reflected in every news outlet, will have a lasting impact on the sector.  

Reflecting back on the news that NIC continues to curate on our www.seniorcare.nic.org resources page, it is possible to see how the headlines trace this period of disruption – and how this crisis will shape the delivery of healthcare in seniors housing for years to come. 

Before COVID-19, the sector was already moving towards healthcare partnerships and innovation in numerous ways. A January 15 Senior Housing News story, “Welltower CEO Touts Expanding Health System Initiatives, Teases ‘Welltower Living’ Brand,” highlighted how important healthcare was becoming, before the crisis hit. Writer Tim Mullaney opened the piece with:  

Welltower is moving forward on all cylinders with its strategy of closely aligning senior housing with health systems. In addition to a recently announced relationship with Jefferson Health, the real estate investment trust (REIT) is in the process of working closely with Geisinger Health in Pennsylvania, CEO Thomas DeRosa said Wednesday at the J.P. Morgan Healthcare conference in San Francisco.”  

Referring tDeRosa, Welltower CFO Tim McHugh was quoted as saying, “Tom often says that we’re a health care company that expresses our view of where health care is going through our ownership of real estate.”  

As hundreds of visitors to our curated headlines section know, many stories were already casting light on a movement to break down old silos and forge new partnerships, secure new technology, and collaborate with healthcare partners.  

Reporter Chuck Sudo’s story, “Brookdale Eyes Health System Opportunities as Assisted Living Turns a Corner,” published by Senior Housing News February 19, focused on the management decisions driving assisted living into the healthcare continuum. 

Discussing the strategic hiring of Cindy Kent as executive vice president and president of its senior housing arm, Brookdale CEO Cindy Baier said, “With the changes happening in health care moving from fee-based services to pay for performance, there are better opportunities to partner with health systems to make assisted living a part of the care continuum. Having someone [like Kent] who worked in other aspects of the spectrum is important,” Baier told SHN. 

Covering the 2020 NIC Spring Conference, on March 10, Globe Street writer Natalie Dolce submitted the article, NIC 2020 Talks Future of Healthcare Disruption, Scale Will Matter. The piece focused on NIC Founder and Strategic Advisor Robert Kramer’s remarks. At the time there was dawning awareness of COVID-19 in the U.S., but no one who knows Kramer was surprised to hear his argument that a period of disruption, converging housing and healthcare, and forging innovation and new models, was upon us.  

As Dolce reports, “He explained that healthcare players traditionally involved in creating networks to provide acute care are expanding to emphasize wellness, care coordination, and management of chronic conditions to prevent acute care episodes. The reality is that things are changing. We have an enormous opportunity and we are part of the discussion. Kramer may not have known how quickly things were, in fact, about to change. 

Only 12 days later, stories on CMS’ decision to expand coverage for telehealth, as a means to combat COVID-19, were appearing. Tim Regan’s March 17 Senior Housing News story, “New CMS Telehealth Expansion Could Be ‘Very Good’ for Senior Living During Covid-19,” pointed to the need for this technology in seniors housing:  

“’Any expansion of telehealth services is a very good thing, Kari Olson, chief innovation and technology officer for Glendale, California-based senior living provider Front Porch, told Senior Housing News. “Especially during this time when we need folks to stay home, and in particular, to safeguard people over 65 as well as other high-risk individuals.” 

Regan’s story closes with the observation that, “Many within the industry have touted the promise of telehealth in senior living settings, and this expansion could serve to demonstrate its value in the real world. Medicare Advantage (MA) policy changes enacted last year already make it easier for senior living residents to receive care such [sic]in the independent living or assisted living community where they live rather than in a health care facility. 

By the end of the month, telehealth had become a far more accessible and long-term fixture across the seniors housing and care sector. Alex Spanko’s March 31 Skilled Nursing News’ piece, “Skilled Nursing Telehealth Adoption Not Without Challenges — But COVID-19 Changes Likely Here to Stay” reflects a new reality.  

Spanko interviewed Dr. Grace Terrell, CEO of the skilled nursing-focused physician group Eventus WholeHealth, about their roll out of telehealth programs in 500 facilities.  “I don’t think you’re going to be able to put the toothpaste back in the tube,” Terrell said. “We’re not going to go back; things will change.”  

Throughout the month of April, there was a flood of headlines concerning COVID-19. Given the pandemic’s impact on the seniors housing and care sector – and the millions of frail elders in its care – NIC launched its NIC COVID-19 Resource Center, along with numerous initiatives designed to collect and analyze relevant data, disseminate information, host public discussion, and facilitate meetings amongst peers and experts.  

We recommend visiting the NIC COVID-19 Resource Center, where you can subscribe to the new NIC Weekly Recap: COVID-19 Newsletter” for all the latest information and developments relevant to the pandemic. You will also find recordings and summaries for the highly popular “NIC Leadership Huddle” webinar series, and can access results and analysis for the “Executive Survey Insights,” which provides unique insights into the impact of the pandemic across the sector. 

Of course, we will continue to curate articles relevant to the developing trends in healthcare innovation, collaboration, and partnerships which continues to shape the future of the sector. News is developing very quickly, as is the impact of the COVID-19 pandemic, and NIC remains committed to keeping you informed as it develops. As we are all seeing in real-time, today’s headlines are outlining the shape of a new normal in the months and years ahead. 

Five Key Takeaways from NIC’s First Quarter 2020 Seniors Housing Data Release

Key takeaways from NIC MAP® Data Service client webinar on key seniors housing data trends during the first quarter of 2020.

NIC MAP® Data Service clients attended a webinar in mid-April on the key seniors housing data trends during the first quarter of 2020. Key takeaways included the following:

Takeaway #1: Seniors Housing Occupancy Largely Unchanged in 1Q 2020  

  • The first quarter data does not reflect the effects of the COVID-19 pandemic. It effectively sets the stage at the onset of the pandemic.
  • Dating back to late 2017, the seniors housing occupancy rate has been generally flat, with only 10 to 20 basis point changes from one quarter to the next.
  • More specifically, the occupancy rate for seniors housing was 87.7% in the first quarter of 2020, down 20 basis points from the fourth quarter of 2019 (87.9%) and from the first quarter of 2019.
  • For seniors housing, net absorption (3,078 units in the first quarter), was less than inventory growth (of 4,305 units).

NIC 1Q2020 Seniors Housing Data Release

Takeaway #2: One Third of Properties Have 95% or Higher Occupancy

  • There is a wide range of property level performance within the largest metropolitan markets. The average occupancy rate alone is not a tell-all indicator of a metro market.
  • The median occupancy rate—which is defined as the mid-point of the distribution, with an equal number of properties below that rate as above that rate—is pulled higher compared with the average occupancy rate because more than one-third of the properties within the 31 NIC MAP Primary markets have a 95% occupancy rate or higher. Moreover, more than half of all properties have rates higher than 90%.
  • The flip side is that the average occupancy rate is being pulled down by the 31% of properties with occupancy rates below 85%, with a full 22% of properties having occupancy rates less than 80%. Those 22% of properties with less than 80% occupancy are likely to have financial challenges in a COVID-19 environment.

NIC 1Q2020 Seniors Housing Data Release

Takeaway #3: Seniors Housing Occupancy Year-over-Year: 15 Markets Up, 15 Markets Down

  • This slide shows a comparison of occupancy rates among the NIC MAP Primary 31 seniors housing markets.
    • For perspective, the 31 Market average was 87.7%, as seen in the middle of the slide by the green bar. Fifteen markets had occupancy rates higher than the Primary Market average. Starting on the left is the market with the highest first-quarter occupancy rate: San Jose, at 95.0%, followed by San Francisco at 91.5%. Then there are five markets with occupancy rates at 90%: Minneapolis, Baltimore, Boston, Los Angeles, and Portland OR.  
    • At the other end of the spectrum is Houston, with an occupancy of 82.1%, followed by Atlanta (82.7%), Las Vegas (83.0%), San Antonio (83.5%) and Phoenix (84.2%).
    • In the first quarter, 15 markets had occupancy rates lower than year-earlier rates, while 15 had occupancy rates higher, and one was unchanged. The market with the most improvement was Cleveland where occupancy rose 3.5 percentage points to 84.9% from 81.4% one year ago, while the market with the greatest deterioration was Pittsburgh where occupancy fell more than three percentage points from 89.9% to 86.6%.

NIC 1Q2020 Seniors Housing Data Release
Takeaway #4: Annual 2019 Inventory Growth Slowed for Assisted Living

  • Since the onset of the pandemic, NIC has been conducting a weekly Executive Survey Insights, a new survey designed to collect timely insights into the impact of COVID-19 on operators in the seniors housing and skilled nursing sector.
  • The chart below presents findings from responses collected at the beginning of the pandemic in mid-March to the week ending April 12th. The data represents responses from 180 and 146 owners and C-suite executives across the nation who answered the questionnaire in Wave 1 and Wave 2, respectively.
  • Approximately one-third to one half of organizations reporting on their independent living, assisted living and memory care units in Wave 2—across their respective portfolios of properties—saw a decrease in occupancy from the prior month. Roughly one fourth saw a decrease compared with the prior week. There were more survey respondents reporting a decrease in occupancy in Wave 2 results than in Wave 1 results.
  • Conversely, roughly half to two-thirds of organizations reporting on their independent living, assisted living and memory care units in Wave 2 saw no change or an increase in occupancy rates from the time they responded April 1-April 12, 2020 to one month prior; down from roughly two-thirds to three-quarters in Wave 1.
  • Organizations with nursing care beds reported the largest directional declines in occupancy among the four segment types and more respondents reported declines in Wave 2 than in Wave 1. Nearly three-quarters to half of organizations with nursing care beds and assisted living units reported occupancy declines in Wave 2. This may be driven by fewer hospitals discharging patients to post-acute care settings for rehabilitative therapy as hospitals defer elective surgeries due to the pandemic.

NIC 1Q2020 Seniors Housing Data Release

If your organization would like to participate in the weekly Executive Survey, please click here to access the survey tool. 

Key Takeaway #5: Seniors Housing Pricing Off Recent High

  • This slide presents the rolling four-quarter price per unit for seniors housing and price per bed for nursing care.
  • The price per unit and price per bed came off their recent highs as both seniors housing and nursing care decreased from the fourth quarter 2019.
  • Seniors housing decreased 2% quarter-over-quarter to end the first quarter at $193,200 price per  -unit, but that was an increase of 14% from the prior year.
  • Nursing care decreased slightly to end the quarter at $78,700 price per bed, however that was also an increase from the prior year, increasing 20% year-over-year.

NIC 1Q2020 Seniors Housing Data Release


4Q2019 Seniors Housing Actual Rates Report Key Takeaways

The NIC MAP® Data Service released national monthly data through December 2019 for actual rates and leasing velocity.

The NIC MAP® Data Service recently released national monthly data through December 2019 for actual rates and leasing velocity. In this release, NIC also provided data on three metropolitan areas for which there is enough data to report upon:  Atlanta, Philadelphia and Phoenix. 

Key takeaways from the 4Q2019 Seniors Housing Actual Rates Segment Reports include:

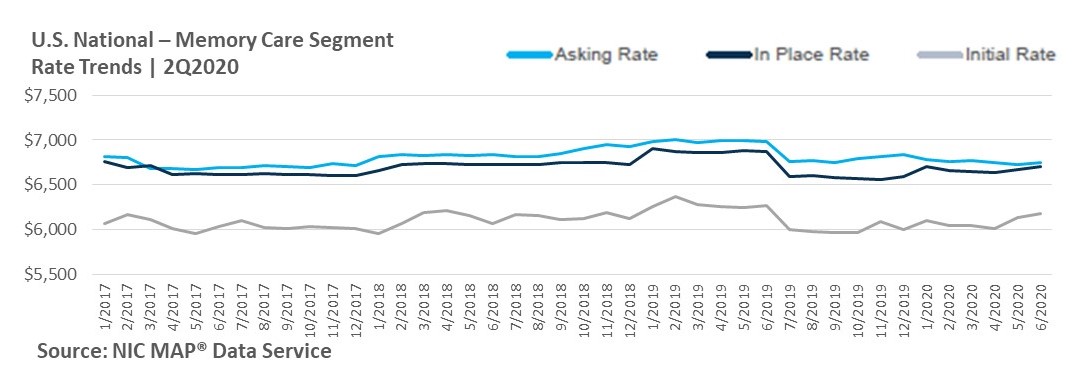
  • Average initial rates for residents moving into independent living, assisted living and memory care segments were below average asking rates, with monthly spreads generally largest for memory care, followed by assisted living segments and then independent living segments. Care segments refer to the levels of care provided to a resident living in an assisted living, memory care or independent living unit.
  • As of December 2019, initial rates for assisted living care units averaged 8.1% ($414) below average asking rates. This equates to an average initial rate discount of 1.0 months on an annualized basis, the same as the year-earlier discount.
  • The average discount for the memory care segment was the largest of the three segment types and averaged 12.3% below average asking rates. This equates to an average initial rate discount of 1.5 months on an annualized basis. In October 2019, the discount was the same.
  • Of the three metropolitan markets for which NIC MAP is currently reporting data (Phoenix, Philadelphia and Atlanta), the largest discounts occurred in Atlanta in December 2019. As of December 2019, initial rates for assisted living segments in Atlanta averaged 16.3% below their average asking rate, which equates to an average initial rate discount of 2.0 months on an annualized basis, up from 1.3 months one year earlier. This was higher than the comparable discount of 1.0 month for the nation and 0.4 month for Philadelphia. Moreover, in Atlanta, the average discount for independent living segments was slightly more than assisted living and equivalent to 2.1 months in December.
  • Higher discounts in Atlanta make sense, since that market had the second lowest seniors housing occupancy rate of the 31 Primary NIC MAP markets in the fourth quarter of 2019 (82.7% versus 88.0% for the Primary Market average), as well as the third-highest share of construction versus inventory (12.1% versus 6.7% for the Primary Market average).
  • At the national level, average asking rates for residents moving into independent living, assisted living and memory care segments were above in-place rates, with monthly differences generally largest for assisted living, followed by memory care segments and then independent living segments.
  • Average asking rates for the independent living segment exceeded in-place rates since March 2018 and the monthly gap between these rates was 3.4% or $119 in December 2019.

The NIC Actual Rates initiative is driven by the need to continually increase transparency in the seniors housing sector and achieve greater parity to data that is available in other real estate asset types. Now, more than ever, in the world of the COVID-19 pandemic, having access to accurate data on the actual monthly rates that a seniors housing resident pays as compared to property level asking rates helps NIC achieve this goal. That said, the data reported in this blog post does not reflect the effects of the pandemic, but better serves as a baseline for the conditions that prevailed prior to the coronavirus.

This Seniors Housing Actual Rates Report provides aggregate national data from approximately 300,000 units within more than 2,500 properties across the U.S. operated by 25 to 30 seniors housing providers. Note that this monthly time series is comprised of end-of-month data for each respective month. The operators included in the current sample tend to be larger, professionally managed, and investment-grade operators as we currently require participating operators to manage 5 or more properties.

While these trends are certainly interesting aggregated across the states, actual rate data is even more useful at the CBSA level. As NIC continues to work towards growing the sample size to be large enough to release more data at the CBSA level, partnering with leading software providers like Yardi, PointClickCare, Alis, and MatrixCare makes it easier for operators to contribute data to the Actual Rates initiative. NIC appreciates our partnerships with software providers and our data contributors and their work in achieving standardized data reporting.

If you are an operator or a software provider interested in how you can contribute to the Actual Rates initiative, please visit nic.org/actual-rates.
Learn more about the NIC MAP® Data Service.