The occupancy recovery for senior housing will likely be sustained during the near-term given current supply and demand conditions.
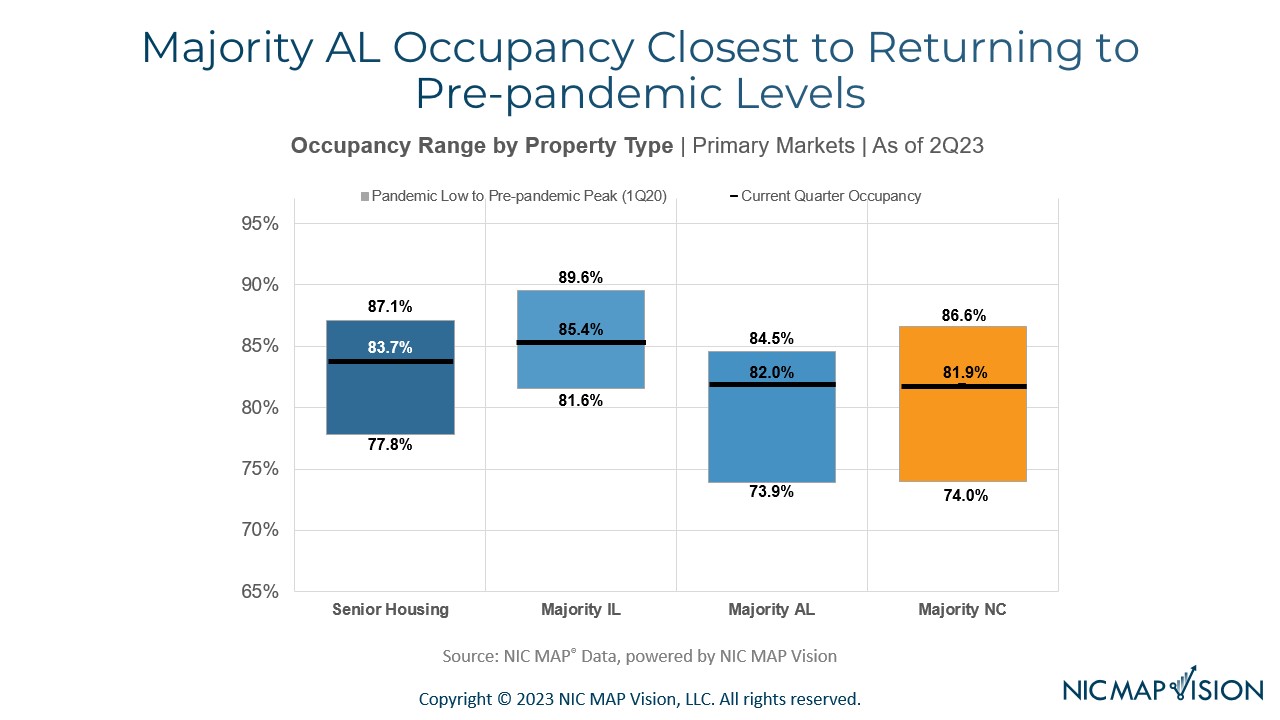
The all-occupancy rate for senior housing for the NIC MAP Primary Markets increased to 84.2% in the July 2023 reporting period, up 0.5 percentage point (pps) from the June 2023 reporting period on three-month rolling basis, according to intra-quarterly NIC MAP® data, released by NIC MAP Vision. From its pandemic record low of 77.8% in June 2021, senior housing all-occupancy increased by 6.4pps and is now 2.9pps from the pre-pandemic March 2020 level of 87.1%.
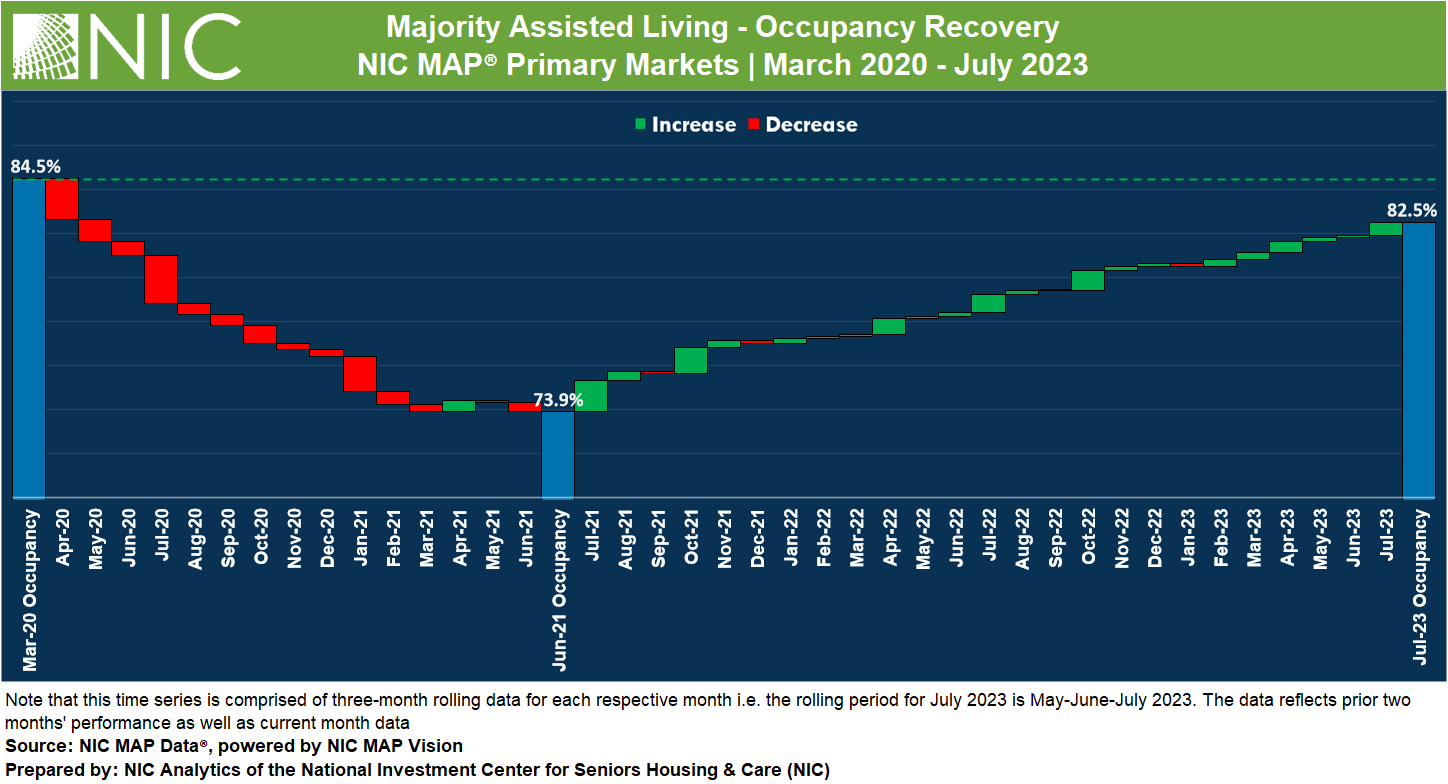
Occupancy Recovery by Majority Property Type. At 85.8%, the all-occupancy rate for majority independent living (IL) properties for the NIC MAP Primary Markets increased 0.3pps from June 2023 but remained 3.8pps below March 2020 levels. For majority assisted living properties (AL), the all-occupancy rate for the NIC MAP Primary Markets was up 0.6pps to 82.5% from June 2023 and is now 2.0pps below March 2020 levels. Occupancy for AL continued to recover relatively fast compared with IL. From pandemic related low, all-occupancy for AL increased by 8.6pps, more than double the increase for IL (up 4.2pps since March 2021).
The senior housing market is demonstrating a steady recovery, with demand and occupancy continuing to rise. A new ratio developed by NIC Analytics offers further insights into these encouraging trends. This new measure offers a nuanced perspective on the balance between demand and supply and occupancy outlook. Called the absorption-to-inventory velocity (AIV), this ratio serves as an indicator of how effectively the market absorbs or leases the newly supplied units on a net basis.
In the second quarter of 2023, the AIV ratio (on a rolling 4-quarter basis) for majority assisted living was 38:10 for the Primary Markets. This means that for every 10 new units added, there was positive absorption of 38 units in the Primary Markets. The AIV ratio for majority assisted living properties reached an all-time high, far exceeding any level recorded since NIC MAP Vision began reporting data in 2005, suggesting an ongoing trend of high acuity demand in the senior housing market and that the recovery will likely be sustained during the near-term given current supply and demand conditions. In the August 2023 NIC Insider Newsletter, we explore the AIV ratio in greater detail.
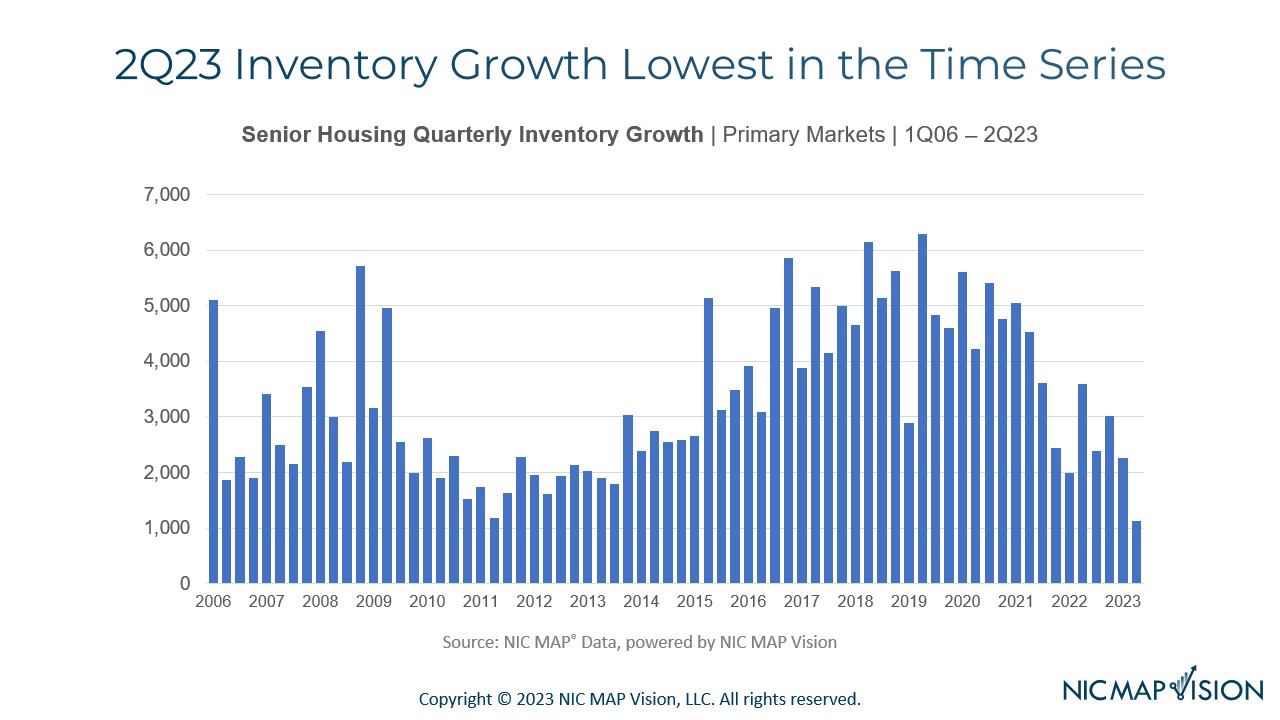
The inventory of majority independent living properties for the NIC MAP Primary Markets increased by 1.2% or 4,097 units from year-earlier levels in the July 2023 reporting period. AL inventory increased by 1.3% over this same period.
Occupancy Recovery Across Select Metropolitan Markets. The all-occupancy rate for majority independent living properties increased or remained stable in 27 of the 31 Primary Markets in the July 2023 reporting period compared with June 2023. At 86.8%, Riverside IL occupancy saw the largest increase from the prior month, up 1.5pps and is now 3.2pps above March 2020 levels. San Antonio IL occupancy fell by 0.5pps in July 2023 to 86.0%, marking the largest decline from June 2023. However, this rate is still 0.8pps higher than the pre-pandemic level in March 2020.
For AL, the all-occupancy rate increased or remained stable in 28 of the 31 Primary Markets in July 2023. At 78.3%, Houston AL occupancy saw the second largest increase, up 1.3pps from June 2023. The AL occupancy rate in Miami had the largest decline and fell 0.7pps from June 2023 to 83.2%. Both Houston and Riverside occupancy rates remained 1.4pps below pre-pandemic levels.
Keep track of the most timely comprehensive review of the sector’s market fundamentals and trends. The NIC Intra-Quarterly Snapshot monthly publication, available for complimentary download on our website, continues to provide a powerful and closely watched means to stay ahead of industry trends, even as senior housing markets sustain a fast pace of evolution and adaptation, amidst an apparent recovery.
The August 2023 Intra-Quarterly Snapshot report will be released on our website on Thursday, September 14, 2023, at 4:30pm.
Interested in learning more about NIC MAP Intra-Quarterly data? To learn more about NIC MAP Vision data, schedule a meeting with a product expert today.